Sep 2025
Sep 2025
Silver Surges Past $40 Amid Critical Material Buzz
By Rhona O'Connell, Head of Market Analysis
The gold tariff confusion, price dislocation and associated issues.
see this StoneTV interview it’s a four-minute exercise.
- Silver has been proposed to be put onto the list of Critical Materials in the United States, which helped to fuel the surge through $40. Explanation below
- Last trading at $40.6, the highest since September 2011
- Gold followed suit in Asia with no discernible trigger apart from piggybacking on silver. Momentum traders obviously also became involved
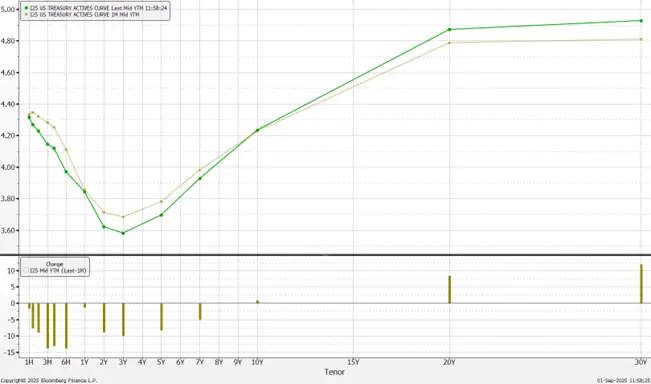
- The dollar remains under pressure while the yield curve steepens; see below
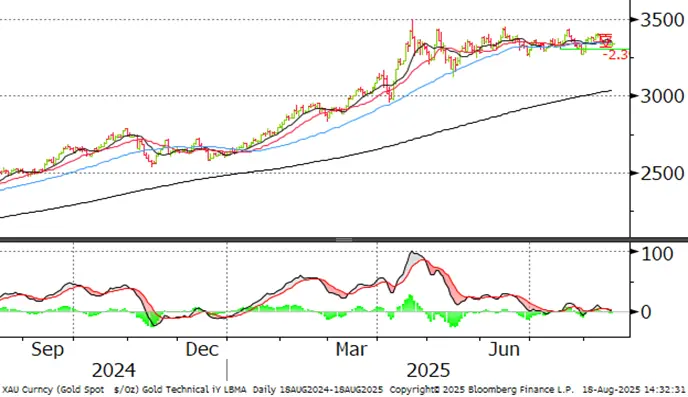
- While gold hit its highest level this morning ($3,490) since 22ndApril when it hit a record in both nominal and real terms in US dollars, it has been outperformed in rupee and yen terms while in other major currencies it is level with, or below, the levels hit on the earlier date
- Continued concerns over the aggressive mood music from the White House towards the Fed is adding fuel to the fire
- A 25-point rate cut is priced into the market; the next FOMC meeting is September 16th – 17th; and will include the projections for the fed funds target
- A Federal Appeals Court has upheld a ruling from the Court of International Trade that ruled that the US‘ global tariffs were illegally imposed under an emergency law, but they remain in place as the case proceeds. The ruling may yet also be applied only to those nations that brought the action.
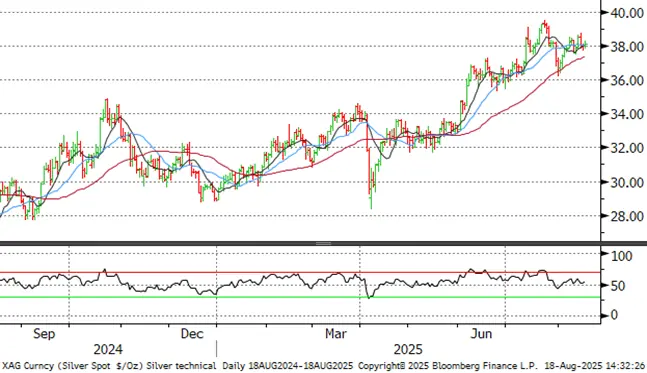
Outlook: unchanged. For the much longer term, silver has a robust fundamental outlook but for now, after the very strong performance at the end of last week and the start of this, it is overbought above $40 and needs to correct and consolidate. The solar market remains oversupplied but still has a constructive future, while AI and vehicle electrification will also help to keep the market in a pre-investment deficit. Gold is fully pricing in concerns over Fed independence and the avalanche of comments from the C-Suite in the leading US banks is raising the stakes.
US fed funds rate – makrets pricing in 90% chance of a cut in September

Silver’s potential insertion into the Critical Minerals list; implication
To qualify for inclusion in the Critical Minerals list (which was set up in President Trunp’s first term) a commodity must meet three criteria:
- It must be deemed essential to the US’ ecnomy or its defence
- It must be vulnerable to supply chain disruption, including restrictions associated with foreign political risk, abrupt demand growth and other geopoliticial risk elements
- It must be vital to manufacturing applications includring agriculture, consumer electronics, currency, energy, healthcare and technology.
The list is updated every three years and the 2025 iteration has now been drafted; silver is on the proposal along with copper, lead, rhenium, potash and silicon. The US Geological Survey’s report includes the following: “The concentration of mineral commodity production in a few countries and the high degree of reliance of the United States on imports from these countries increases the risks associated with foreign supply disruptions”. The USGS applies two criteria; the potential effects of foreign trade disruptions on the US economy; and whether there is a single producer of the coommodity in the US. As far as silver is concerned the USGS included the following: “Silver’s probability-weighted net decrease in U.S. GDP is largely due to a scenario in which Mexico stops silver exports to the United States—a high impact ($435 million), low probability (4 percent) event.
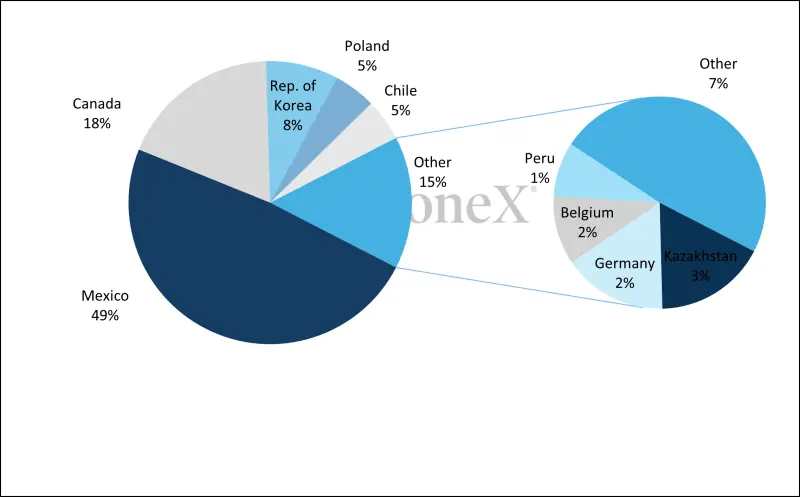
So we have a situation where industrial demand for silver is expandiing and will keep the metal in a global pre-investment deficit; and the tensions between the US and Mexico and Canada are also pertinent. Based on the UN’s trade figures, during 2024 Mexcio and Canada accounted for 49% and 18% of US silver imports respectively, comprising 2,823t and 1,070t from a total of 5,813t.
US: silver imports, 2024
Source: UN Comtrade, StoneX
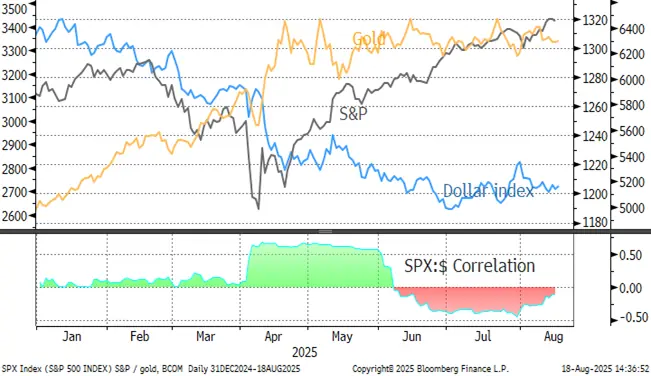
The S&P, gold and the dollar
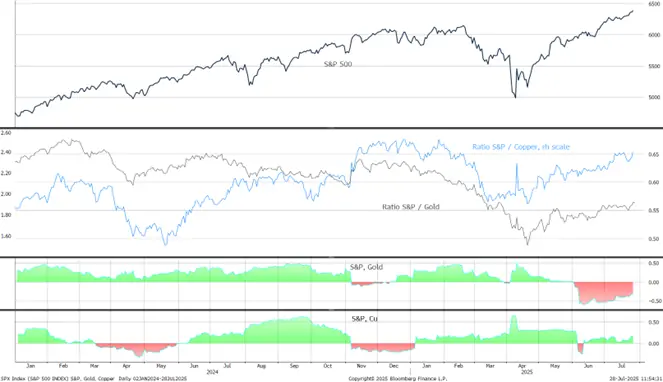
The S&P, gold and copper
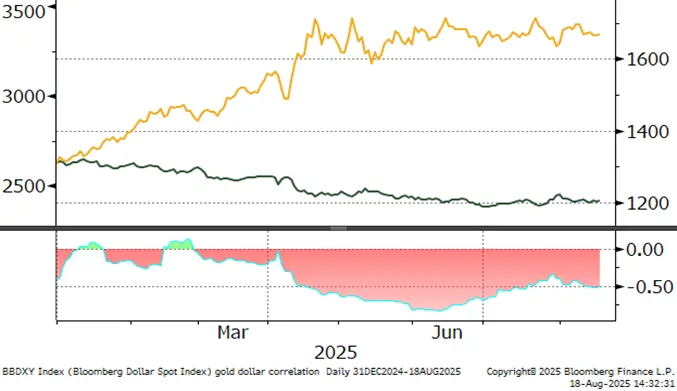
Gold, one-year view; approaching the April high
Gold:dollar correlation; tightening again; now at-0.70
Source: Bloomberg, StoneX
Silver, one-year view; now overbought
Source: Bloomberg, StoneX
US yield curve: steepening as the short end prices in rate cuts while the longer tenors are rising on fears of a longer-term inflationary impact
Source: Bloomberg, StoneX
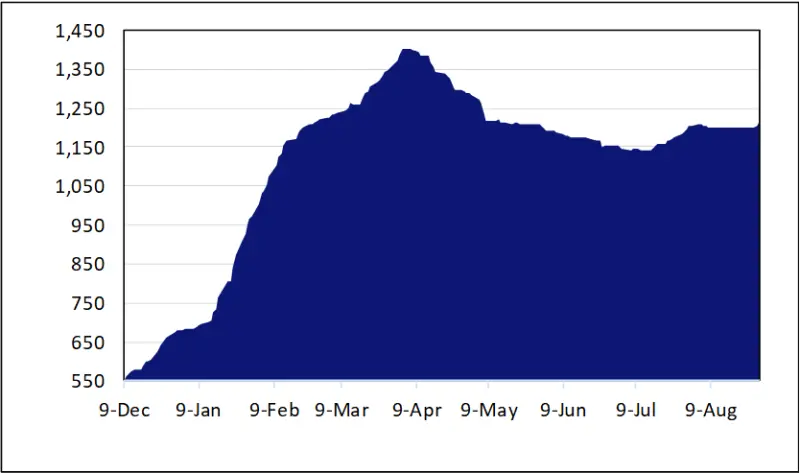
COMEX gold inventories, tonnes
Source CME via Bloomberg, StoneX
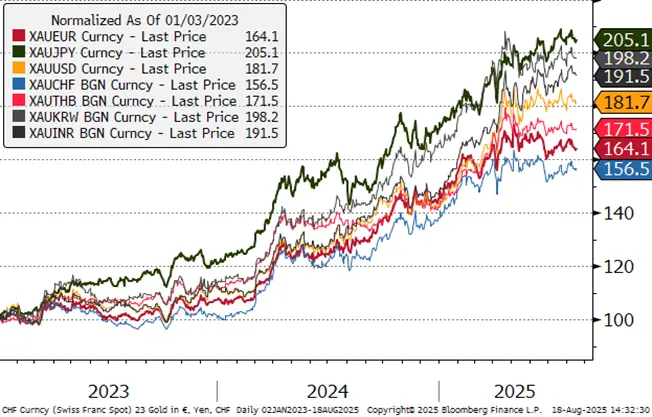
Gold:silver ratio, year to-date
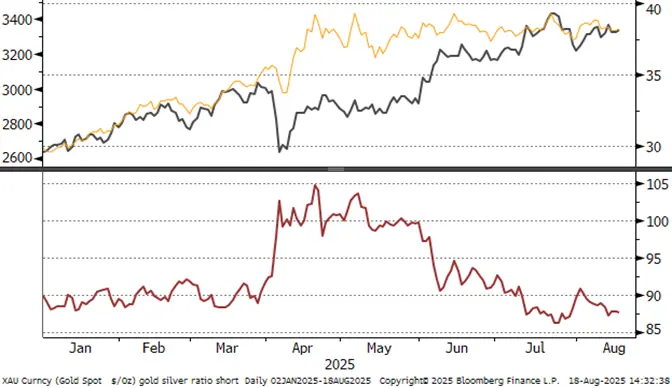
Source: Bloomberg, StoneX
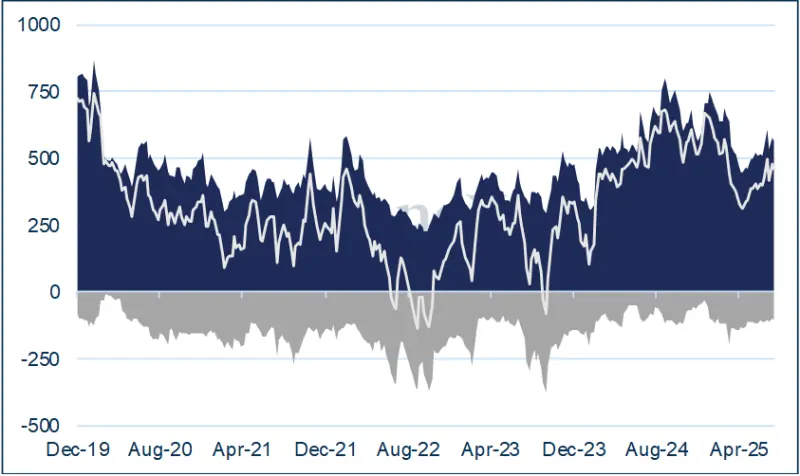
Gold COMEX positioning, Money Managers (t) –
COMEX Managed Money Silver Positioning (t)
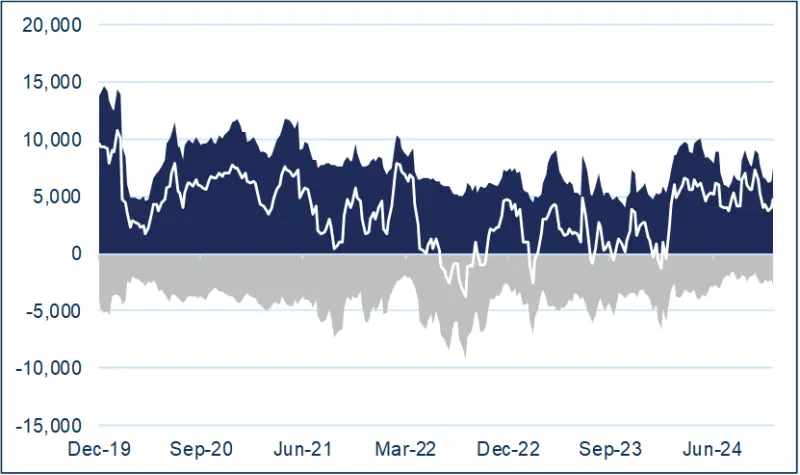
Source for both charts: CFTC, StoneX
CFTC: -gold and silver both showed small net increases in longs and minor short-covering in the week to 26th August.
ETF
Silver: The Bloomberg figures suggest that the net ETF creations in H1 2025 were 1,761t, of which 989t were in June. In other words, 56% of the net gains to that point were in June. Looked at another way, on an unweighted annualised basis, June uptake would be equivalent to 11,864t, or the equivalent of five months’ silver mine production. Activity has been mixed since, but the balance has been favourable with net additions of 541t in July and a further 524t in August to a total of 25,070t, according to Bloomberg. World mine production is just less than 26,000t.
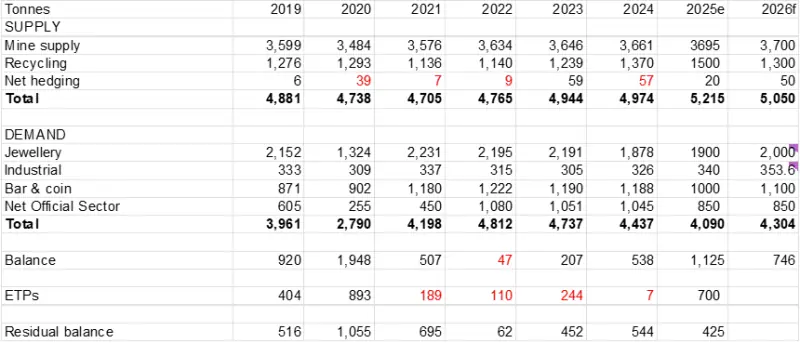
Gold: the latest figures from the World Gold Council, up to 22nd August, show a drop of 5.7t on the previous week, to a total of 3,656.7t. North America shed 9.9t while Europe added 5.2t and Asia showed a small loss of 0.2t. Since then the Bloomberg numbers, which are not as comprehensive as those of the WGC, imply a gain of 29t with six consecutive days of net creations. World gold mine production is 3,661t (Metals Focus figures).

Gold supply-demand balance update:
Source: Metals Focus, StoneX