Nov 2024
Nov 2024
Gold Price Prediction for 2025 and 2026 - 2030
By StoneX Bullion
We predict that the price of gold could soar to around $3,150 in 2025, and by 2026, it could even exceed $3,300. In the years beyond, the gold market might even reach $5,150 by 2030. To sum up: gold’s future looks bright in the coming years.
As a historically trusted safe haven asset, gold continues to attract investors seeking a hedge against inflation, economic instability, and currency fluctuations. While our long-term outlook for gold is bullish, it’s important to remember that the gold market can still experience short-term pullbacks. This is a normal part of all financial markets and won’t derail the overall upward trend we expect for gold.
Below, we outline our gold price predictions for 2025, 2026, and 2030. These predictions are based on solid research, including long-term price charts and intermarket trends – both of which indicate steady growth with occasional pauses over the next few years. Keep reading to dive into the key factors driving our predictions.
Gold price predictions for 2025-2030
Our gold price future predictions are:
- 2024 gold prices: $2,700
- 2025 gold prices: $3,150
- 2026 gold prices: $3,180
- 2030 gold prices: $5,150
Note: Our bullish outlook for gold will remain as long as the price stays above $1,707. Should gold dip below this level – and hold there – it would signal a shift in market dynamics. That said, this scenario is considered highly unlikely based on current market trends.
Long-term gold charts
Our gold price predictions start with a broad analysis using 50-year and 20-year charts. This helps reveal dominant secular dynamics that can guide future expectations.
50-year gold price chart
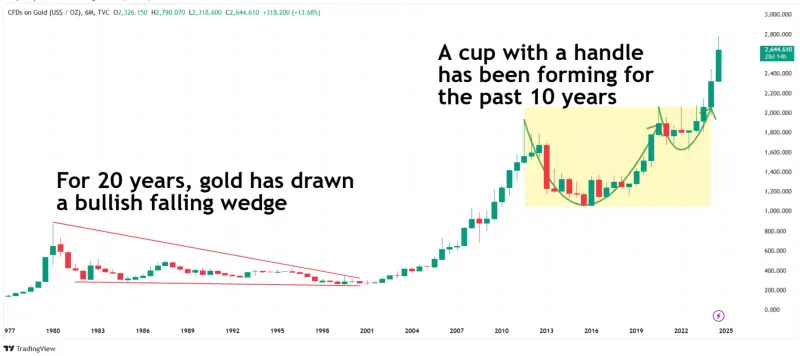
The last 50 years show two secular bullish reversal patterns in the gold chart. The first was a long falling wedge during the 1980s and 1990s, which preceded an unusually long bull market. More recently, we saw a secular cup and handle formation between 2013 to 2023.
These two patterns highlight how long-term consolidations often lead to significant price rallies, making them a reliable indicator of a continued gold bull market. With gold breaking its previous all-time highs for three consecutive quarters, it has officially entered a secular bull market which suggests a steady rise in prices for the next several years.
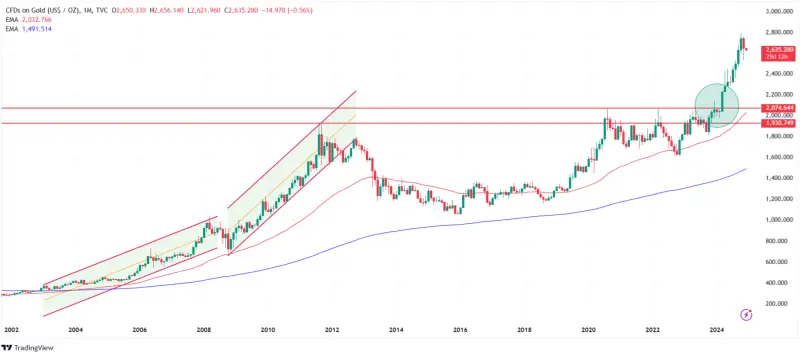
The long-term gold chart shows a different view. Here, we see a rising wedge. This is a typically bearish pattern that could indicate a potential downturn, going against the strongly bullish pattern we see above.

The bearish outcome might happen if gold forms a large wick on its quarterly candlestick chart, similar to what happened in 1980 and 2011. We don’t see this as likely, however, because when gold broke out in April 2024, its price only increased by 30%. In 1980 and 2011, on the other hand, gold’s price soared by triple digits before peaking. As unlikely as the bearish outcome may be, we still think it’s important to consider both possibilities.
20-year gold price chart
Looking at the 20-year gold price chart reveals other insights. Firstly, we see that a gold bull market tends to start slowly and gain momentum towards the end. Secondly, we see that the last bull market unfolded in three distinct phases.
Given the strong cup-and-handle reverse pattern seen between 2013 and 2023, it’s fair to expect a similar multi-phase bull market in the years ahead. At the time of writing – in November, 2024 – gold is firmly in a bull market, which makes us confident about a bullish gold price forecast for the future.
Gold prices & monetary dynamics
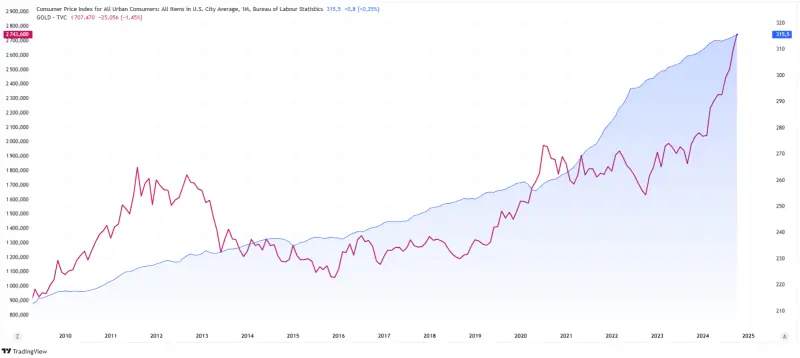
As a financial asset, gold’s value is closely tied to monetary dynamics (seen on the below chart as M2). Historically, gold prices and the monetary base M2 often move together, with gold occasionally rising above M2 temporarily before returning to alignment.
In 2021, M2 began a steep rise, diverging from gold, and started stagnating in 2022. This divergence, while notable, was not sustainable and in 2024, gold’s price surged to catch up with the M2. This pattern confirms gold’s sensitivity to monetary inflation.

Gold also tends to follow inflation rates (CPI), diverging temporarily then returning to realignment. With both the CPI and M2 experiencing steady growth, we expect a gradual, sustainable rise in gold prices for 2025 and 2026.
As central banks aim for a 2% annual CPI, gold’s price will likely continue on this trajectory, reinforcing long-term bullish gold price predictions.
Gold prices & inflation expectations
Inflation expectations are undoubtedly the key driver of gold prices. Gold thrives in an inflationary environment, which is why inflation is the foundation of our gold projections and not traditional metrics like supply and demand or economic outlooks.
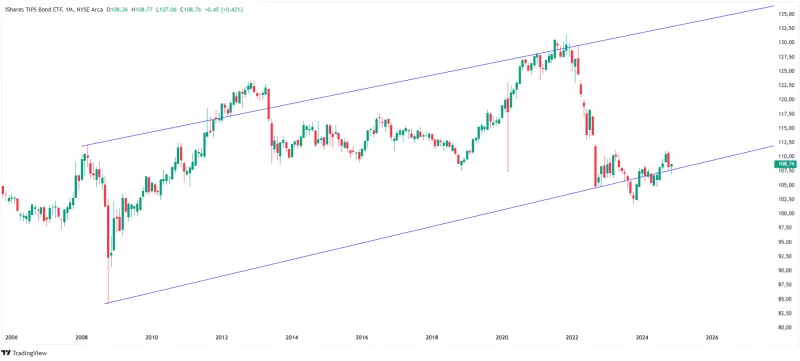
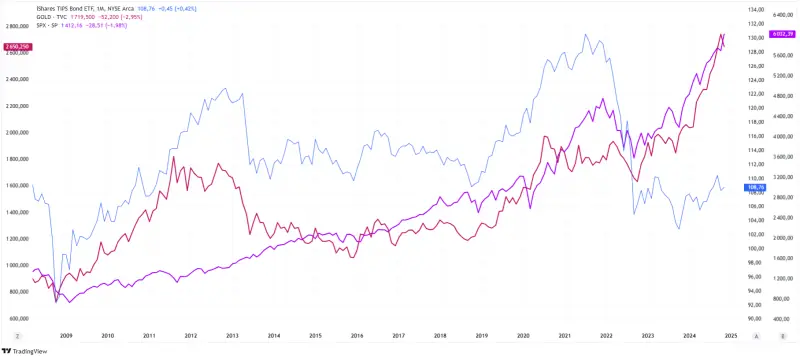
One of the main tools used to track inflation expectations is the Treasury Inflation-Protected Securities ETF (TIP), which has shown a strong positive correlation with gold prices over time. When TIP rises, gold often follows, signaling increased inflation expectations.
While occasional short-term divergences do occur, they rarely last more than six months. This historical pattern highlights gold’s relationship to inflationary trends.
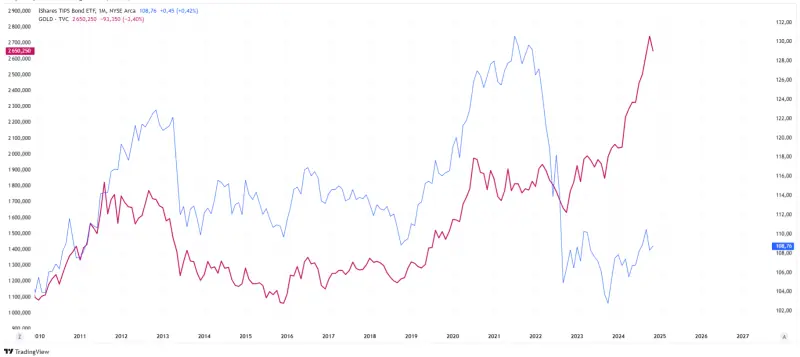
So, gold is positively correlated with TIP – which is positively correlated with the S&P 500. Historically, a decline in TIP has resulted in a decline in gold and stock market prices, and vice versa. This disputes the idea that gold only performs well during recessions or uncertain economic times. Instead, the chart below shows that gold thrives in positive market environments where TIP and other indicators are also rising. As long as TIP remains on an upward trajectory, then gold prices will likely follow suit.
Gold prices and currency & credit markets
Gold prices are also influenced by intermarket dynamics driven by currency and credit markets. There are two key indicators to watch here: EUR/USD and bond prices.
EUR/USD currency movements
Gold’s price tends to move inversely to the USD. When the euro strengthens against the dollar, it typically signals a favorable environment for gold prices. The current EUR/USD exchange rate looks strong, suggesting favorable conditions for gold.

Bond prices and yields
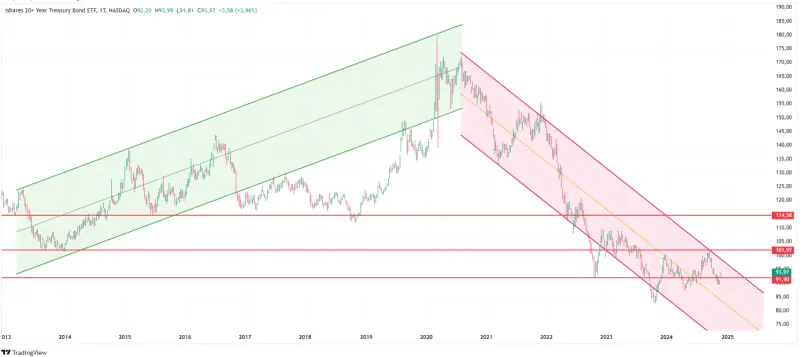
Gold is positively correlated to treasuries, but has inversely correlated to bond yields. This relationship stems from how changes in bond yields affect net inflation rates, a key driver for gold prices. A decline in yields – as seen in the chart below, with rate cuts in mid-2023 – tends to increase gold prices. With rate cuts expected around the world, it’s likely that yields will stabilize and support gold prices.
Gold prices & future market
The futures market also offers insights into gold price predictions through net short positions held by commercials.
The first bar of this next chart shows gold prices over nine years. The middle bar shows net long positions of non-commercials in blue, while red bars represent net short positions of commercials.

Generally:
- Low net short positions signal limited downside for gold prices
- High net short positions – which we see currently – indicate limited immediate upside potential, suggesting a soft uptrend for gold.
Currently, the high level of commercial net short positions – combined with the other factors discussed in this article – reinforces gold’s gradual bullish trend.
Note that the indicator discussed here is linked to the gold price manipulation theory outlined by the late Theodore Butler, who discussed the relationship between gold futures and gold manipulation in-depth.
Summary: Factors behind gold price prediction
Our overall gold price prediction forecast suggests that gold is set to rise in the coming years, driven by several factors:
- Secular trends: Long-term gold charts show a 10-year bullish reversal pattern, confirming the start of a new gold bull market.
- Monetary dynamics: A steady rise in M2 (money supply) and CPI (inflation) support the gold bull market prediction. These factors indicate strong monetary fundamentals driving prices upward.
- Inflation expectations: As the primary driver of gold prices, inflation expectations remain in a long-term rising trend. This supports gold’s bullish outlook.
- EUR/USD & treasuries: The euro and treasuries both show long-term bullish signals, creating favorable conditions for gold.
- Futures market: Current high net short positions amongst commercial traders suggest limited upside but potentially a gradual rise in gold prices.
To wrap up, our 5 year gold price prediction is:
YEAR | PRICE PREDICTION |
2024 | $1,900 to $2,700 |
2025 | $2,350 to $3150 |
2026 | $2,800 to $3,800 |
2030 | $5,150 |
Silver price prediction
We've covered gold – but what about silver price predictions for 2025?
While we expect gold to maintain steady growth over the next several years, silver holds the potential for explosive growth later in the bull market cycle. This is because history shows us that silver tends to surge during the later stages of gold’s bull runs.
The gold/silver ratio – seen in the below chart – is nearing a breakdown point around 75. If it falls below this threshold, silver prices could surge significantly. Historically, we’ve seen that a drop in the gold/silver ratio initiates a period of strong gains in silver.
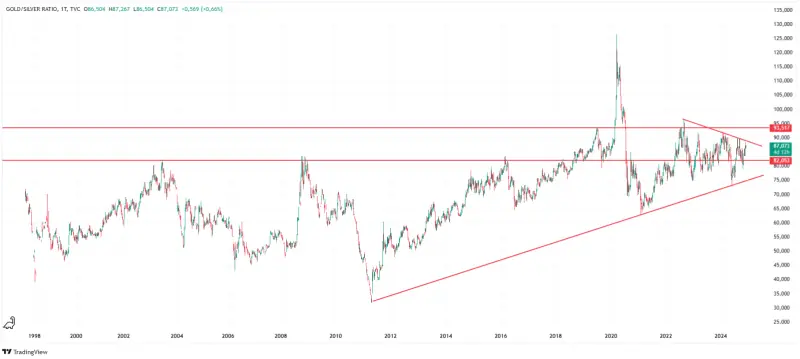
Next, we see a bullish ‘cup and handle’ formation in the long-term silver chart. This suggests that silver may reach new all-time highs, with a target of $50 being realistic in the next few years.
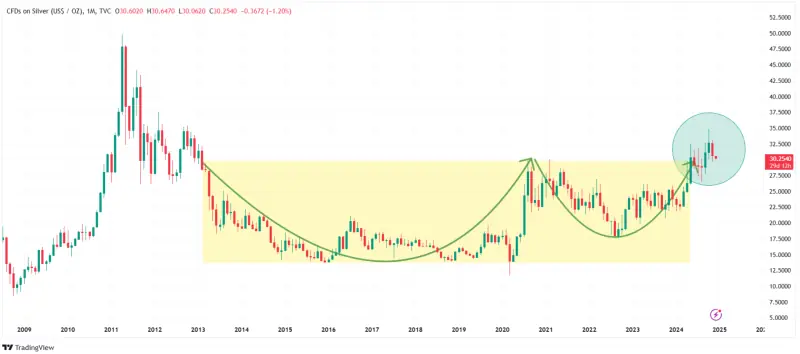
To summarize: gold offers an opportunity for steady growth and stability, while silver could deliver high returns during the later stages of the current precious metal bull market.
Gold price prediction for 2025
Our 2025 gold price prediction is a maximum of $3,150.
Here’s a roundup of 2025 gold price forecasts from major financial institutions:
- ANZ: $2,805 by end of 2025
- Bank of America: $3,000
- Citibank: $3000
- Citi Research: $2,800 to $3,000
- Commerzbank: $2,600 by mid-2025
- Commonwealth Bank: $3,000 average gold price
- Goldman Sachs: $2,900
- HSBC: $2,950
- ING Bank: $2,700 average gold price
- J.P. Morgan: $2,775 to $2,850
- Macquarie: $3,000
- OCBC Bank: $2,900
- Société Générale: $2,800 average price of gold
- UBS: $2,700 by mid-2025
- World Gold Council: $3,000.
Gold price prediction for 2026 - 2030
Our 2026 gold price prediction is a maximum of $3,800.
Gold price prediction for 2030
Our 2030 gold price prediction is a maximum of $5,150.
FAQ: Gold price predictions
What will gold be worth in five years?
By 2030, gold could reach a peak price of $4,500 to $5,000, with $5,150 being a reasonable gold price target.
Could gold ever reach $10,000?
Gold is unlikely to reach $10,000 under normal circumstances, however it’s not impossible. In situations like extremely high inflation, similar to the 1970s, or severe geopolitical crises, gold prices could potentially reach $10k.
What will gold be worth in ten years?
Forecasting gold prices beyond five years is highly speculative due to shifting market conditions. Our 2030 gold price prediction of $5,150 is the furthest we’re able to estimate in the coming decade.
How much will gold be worth in 2030?
We believe that gold has the potential to reach $5,150 by 2030.
How much will gold cost in 2040 or 2050?
Predicting gold prices decades into the future is nearly impossible. Each decade brings unique macroeconomic conditions, making it difficult to make reliable long-term gold forecasts.