Aug 2025
Aug 2025
Gold & Silver Outlook: Prices Hold, Demand Weak
By Rhona O'Connell, Head of Market Analysis
Tariff schedule complicated, still up in the air in some cases; Nonfarm payroll fallout captures the headlines and boosts gold as the labour market is in the Fed’s crosshairs.
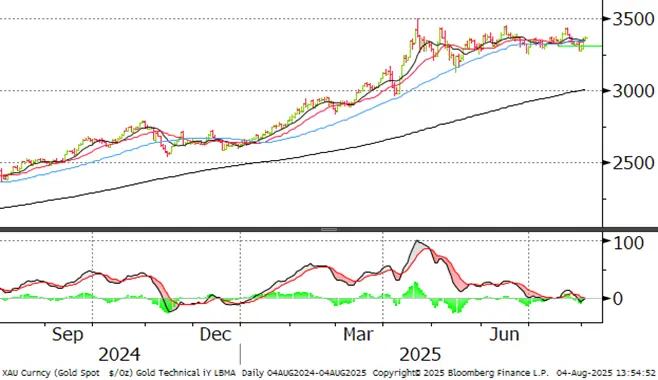
- Gold has remained stuck in the $3,200 to $3,450 range now since April 23rd; and between $3,300 and $3,400 since end-June, although it did show signs of life at the end of last week. Prior to that, further failure at $3,440 on 22nd and 23rd July led, along with continued apparent easing in trade tensions, to a gradual decline until the Nonfarm Payroll employment numbers last Friday.
- The three key moving averages have remained tightly clustered accordingly, between $3,341 and $3,348.
- The physical markets are quiet virtually everywhere as a result of economic uncertainty and the time of year. There is little evidence of much bargain hunting, and equally, the near-market recycling supplies are slow.
- Looking ahead, we are now in the monsoon season in India, which for now at least, is a good one and bodes well for the harvest. Since 60% of the population in India is reliant to one extent or another on the harvest, and farmers favour gold as a primary investment; this currently points to an uplift post-harvest (September) and just ahead of the Festival Season.
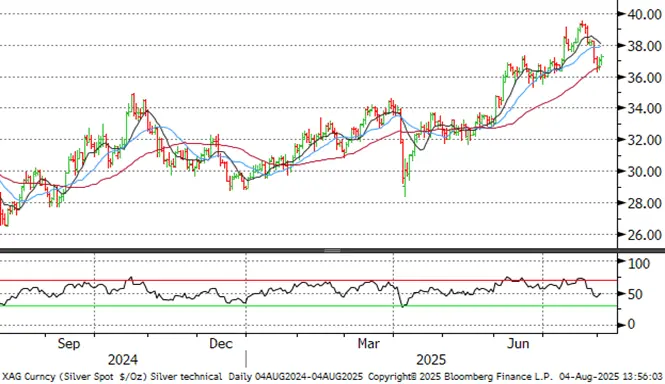
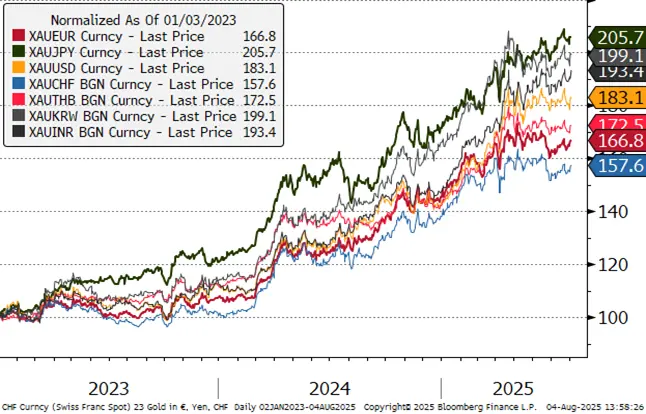
- While gold eased from $3,439 to $3,268 between 23rd and 30th July (2%), silver fell from $39.5 to $36.2, a drop of 8.4%, larger than the normal beta between the two, reflecting economic concerns and an over supplied solar market.
- Prices have since climbed to $37.3, a Fibonacci 38% recovery.
- Retail investment demand is quiet everywhere for silver also and the coin market remains moribund; the Shanghai differential is flat.
- Investment products continuing to be re-sold.
- Gold and silver ETFs both saw net redemptions, silver with increasing momentum.
- COMEX Managed Money saw a bearish reversal in gold sentiment while silver positions contracted on both sides.
- The Fed meeting last week saw the first time since 1993 that the Committee vote was not unanimous.
- Jay Powell made no indication of any rate cut in September.
- The markets reacted swiftly to the weaker Nonfarm payrolls, but Fed Committee members, on the whole, are regarding it as a gradual softening rather than a substantial slowdown.
- Gold’s rally has run out of steam, but prices are consolidating just above the moving averages as we write (last at $3,364).
Outlook: unchanged. For the much longer-term silver has a robust fundamental outlook but for now it is stabilising above $36 with Fibonacci resistance now lower than last week, at $38.77. Gold has unwound some of its long-standing risk premia, but the economic and political environment remains constructive; support at $3,295 was breached briefly last week, but $3,285 there is a good body of support between $3,200 and $3,280.
Comment
Bond markets still pricing in two cuts this year and the projcted rates are lower than this time last week
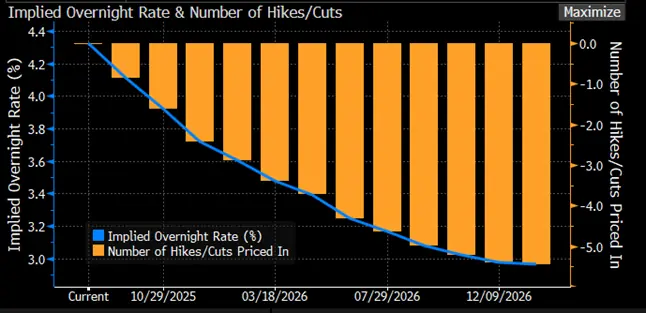
Source: Bloomberg
At his Press Conference after the Fed meeting last week, at which there were two dissenting votes about maintaining the target fed funds rate at its current level, Jay Powell made the point that the dual mandate (2% inflation and full employment) is on the horizon. He implied that an unemployment rate of 4.1% was near full employment, although the core Personal Consumption Expenditure index, which is the parameter that the Fed watches more closely than many others, is still too high at 2.7%.
The Nonfarm payroll headline figure, at 73k, was half the June increase and well below expectations; the markets responded instantly, with gold rallying by roughly $80 or 2.5%, but the move was not sustained. The change included a reduction in the rate of increase in the services sector although there was an absolute decline in the Manufacturing sector, albeit a small one. The two-month net revision was a large downgrade of 258k, which also caught the markets’ attention, as did the increase in unemployment to 4.2%.
Fed officials are taking a more sanguine view than the markets did; the New York Fed President, for example, said on Friday that we are seeing a “gentle gradual cooling” in the labour market, but that it remains “solid”, although he did also point to the downward revisions in May and June, and delivered the phrase “slow-to-hire, slow-to-fire” to describe the sluggish momentum in employment.
Meanwhile Adriana Kugler announced on Friday that she is resigning as a Governor of the Federal Reserve; this, along with President Trump’s firing of the Head of the Bureau of Labor Statistics, strengthens the President’s hand as he will nominate the successors into both posts. The press is reporting that Congressmen and economists are arguing that the President’s action undermines the independence of federal data.
Tariff latest: -
The Trade Policy Uncertainty Index
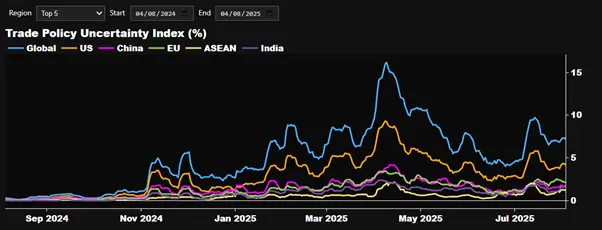
Source: Bloomberg
The majority of US trade counterparties are now subject to 15% tariffs but there are some outliers, and negotiations continue as the tariffs themselves don’t kick in until 8th August. In China’s case it looks as if there will be a further extension, possibly of 90 days.
Some of the rates that have hit the headlines include 30% on South Africa, 35% on Canada (Trump has implicitly tied this into Canda’s recognition of Palestine as a State); 39% on Switzerland, which has raised some hackles, 40% on Libya, 35% on Iraq and 40% on Laos.
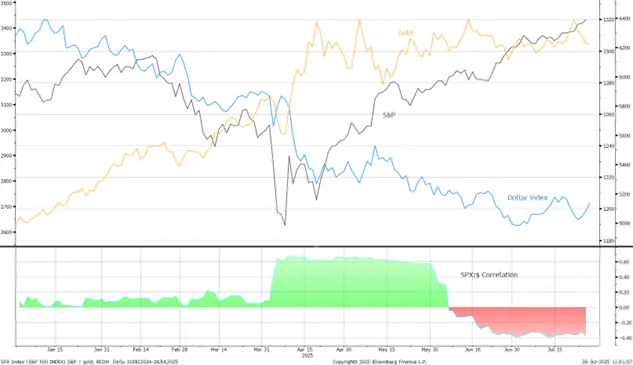
The S&P, gold and the dollar
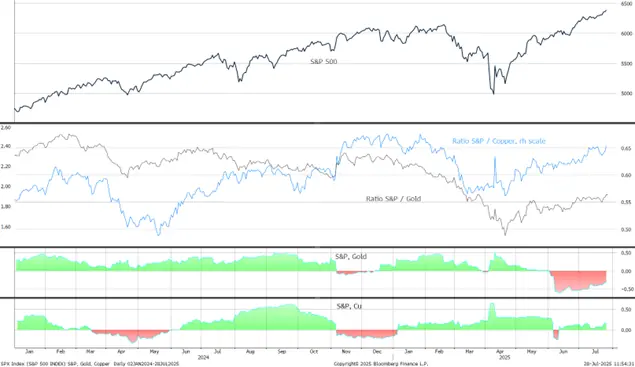
The S&P/Gold and S&P/Cu ratios
Gold, one-year view; still in a worryingly narrow band
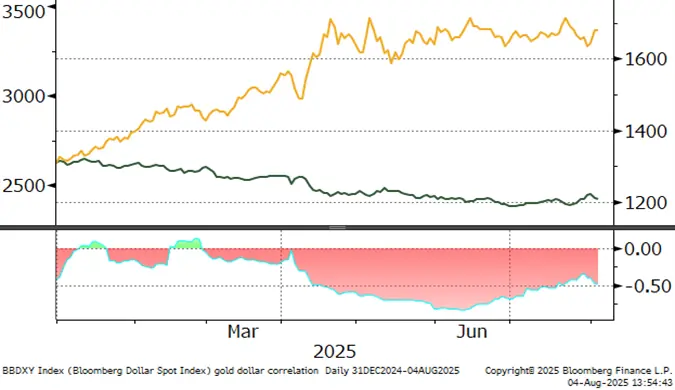
Gold:dollar correlation; contracting again; now at -0.46
Source: Bloomberg, StoneX
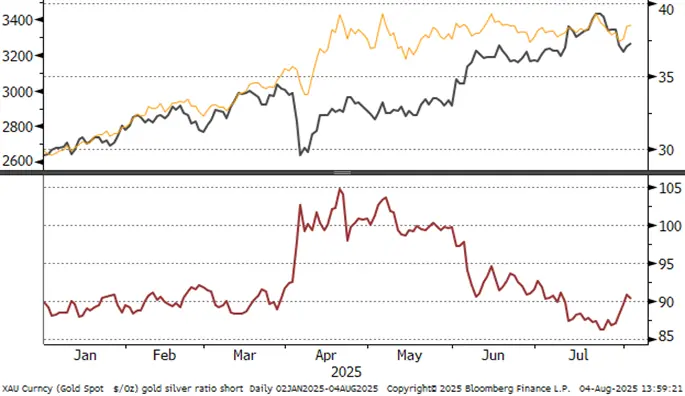
Silver, one-year view; resistance at just below $40
Source: Bloomberg, StoneX
Source CME via Bloomberg, StoneX
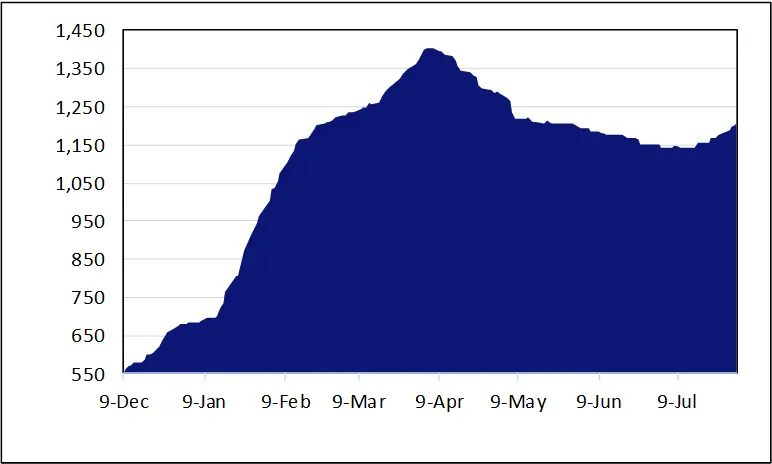
Gold:silver ratio, January 2024 to-date
Source: Bloomberg, StoneX
Background
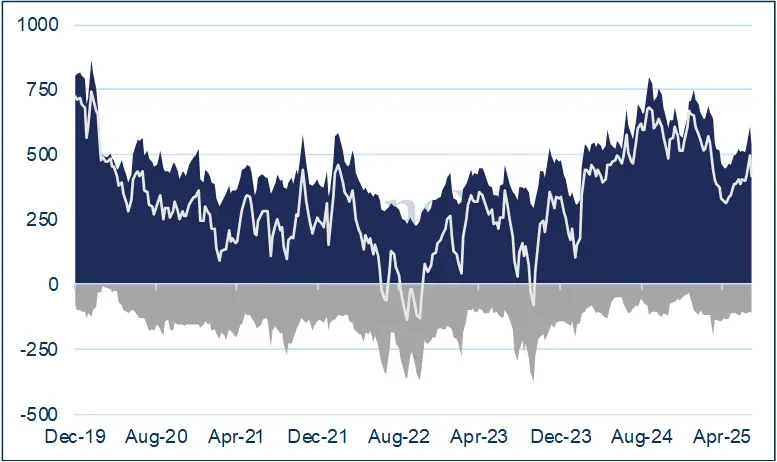
The latest CFTC report is that for 29th July. After expanding from 514t to 606t in the first three weeks of July, the managed money longs contracted to 532t in the final week as gold lost its upward momentum. Shorts expanded fractionally from 108t to 114t. Silver longs also retreated, from 9692t to 9,285t, while there was also some short covering, with positions easing to 2,292t from 2,348t.
Gold COMEX positioning, Money Managers (t) –
COMEX Managed Money Silver Positioning (t)
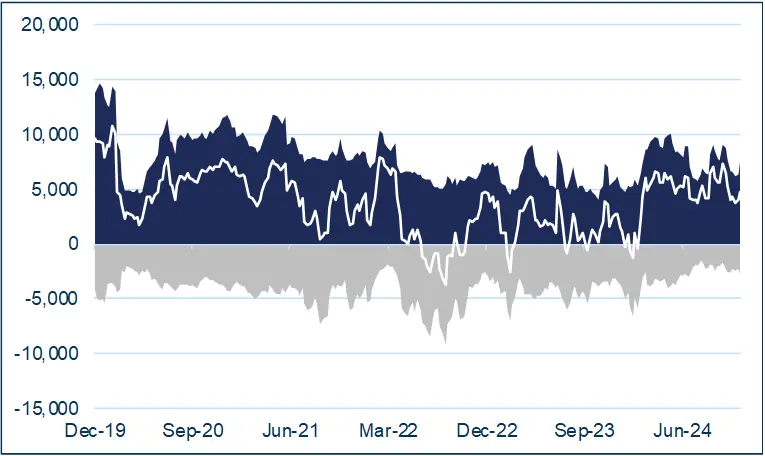
Source for both charts: CFTC, StoneX
ETF
Silver: The Bloomberg figures suggest that the net ETF creations in H1 2025 were 1,761t, of which 989t were in June. In other words, 56% of the net gains to that point were in June. Looked at another way, on an unweighted annualised basis, June uptake would be equivalent to 11,864t, or the equivalent of five months’ silver mine production. Activity has been mixed since and the bout of buying that followed profit taking has now been met with fresh redemptions. World mine production is just less than 26,000t.
Gold: the latest figures from the World Gold Council, up to 28th July, show a slowdown in net creations. This is more a function of reduced buying rather than any heavy sales. In the year to late June net additions were 994t, but in the subsequent four weeks they have dwindled to just 24 to a total of 3,639t. Split: North America, 1,872t; Europe, 1,379t; Asia. 317t after some sales last week; and other, 71t. The year-to-date gains at that stage were 13.4%, 7.1%. 46.6% and 10.5% respectively. Bloomberg figures (not as extensive) imply a fall of three tonnes since, but this is only approximate. World gold mine production is 3,661t (Metals Focus figures).

Source: Bloomberg, StoneX