Aug 2025
Aug 2025
Gold Flat as Tariff Confusion Clouds Outlook
By Rhona O'Connell, Head of Market Analysis
The gold tariff confusion, price dislocation and associated issues;
see this StoneXTV interview it’s a four-minute exercise.
- President Trump said on Social Media that gold would be exempt from tariffs but we are still awaiting further clarification
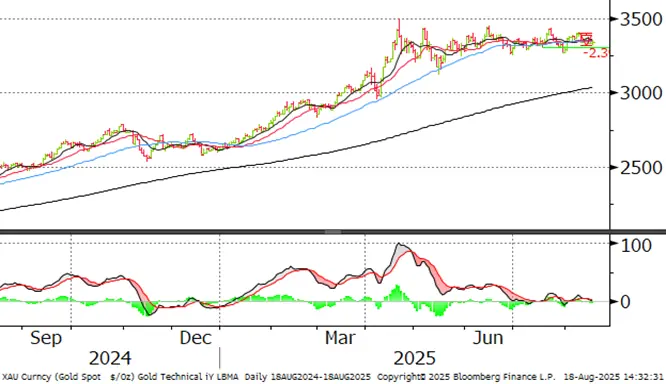
- Spot gold prices are stubbornly refusing to move very far, trading in a mere 2% range over the past week and just 8% over the past three months in a range centred on $3,350.
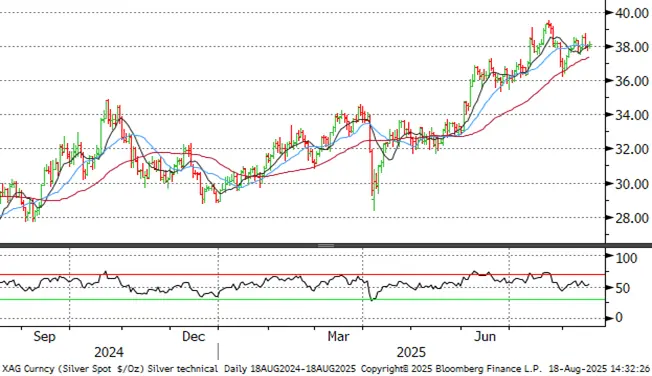
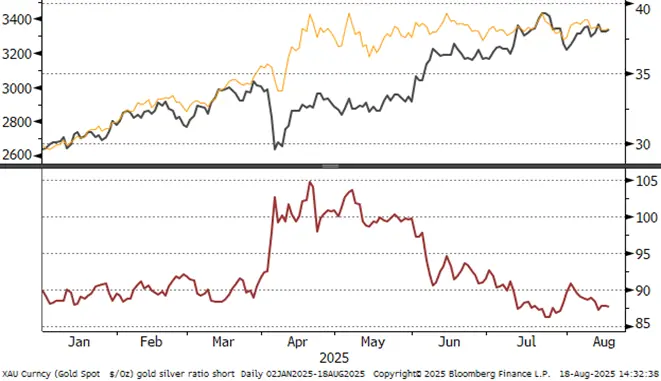
- Silver’s ranges over the same period, by contrast, have been 3% and 23% respectively as silver played catch-up with gold, benefiting from some asset rotation into the white metals. Now steady at $38.
- The physical markets remain seasonally sluggish with the monsoon constraining activity in India and consumer uncertainty still crimping jewellery demand in China. South-east Asia remains mixed.
- The western hemisphere is also moribund, and China is still letting some ETF holdings go.
- India and China typically account for more than 50% of the combined jewellery and coin & bar markets worldwide, but uncertain economic conditions have pushed their share below that key level, if only by a relatively small amount.
- Gold ETFs have seen strong creations so far in August; silver has been mixed with good two-way volume for a net gain so far of 92.5t (Bloomberg numbers)
- At the professional level the blurred outcome of the Alaska meeting between Messrs. Trump and Putin now leads to a meeting with Mr. Zelensky followed by one with EU and NATO leaders.
- US two-year yields continue to fall and while US inflation is still well above the Fed’s 2% target (core PCE latest 2.8%) these reduced yields (currently 3.74%) could possibly force the Fed’s hand at the September meeting
- Data releases are light this week, and most eyes are focused on Fed Chairman Powell’s Keynote presentation at the Fed’s annual meeting at Jackson Hole on Friday.
- Meanwhile I have revised precious metals price forecasts and updated the gold supply-demand balance and forecast; below.
Jewellery and coin&bar markets combined; market share Q2 2024
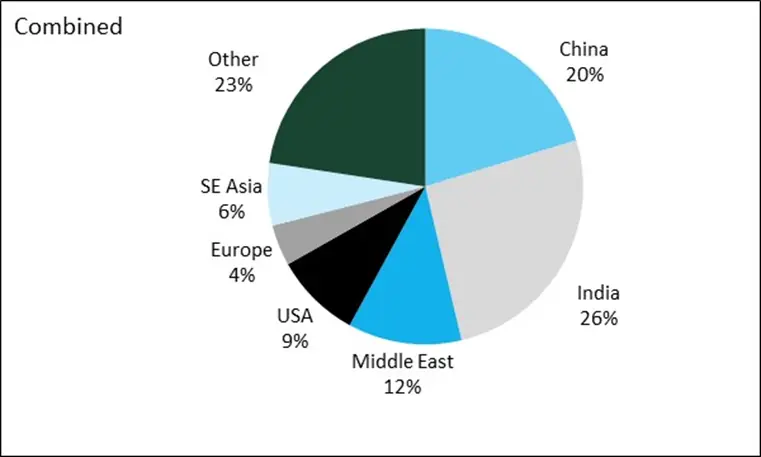
Source: World Gold Council, StoneX
Outlook: unchanged. For the much longer-term, silver has a robust fundamental outlook but for now it is stabilising above $36 while resistance at $38 and above is still proving effective. The speed with which gold futures unwound the premium after the President tweeted about no gold tariffs underpins our view that there is not much upside potential from there, barring a black swan or major geopolitical development.
Our comment on tariffs last week is worth re-iterating and will be found at the end of this piece
US fed funds rate – makrets pricing in 83% cvhnce of a cut in September

Gold supply-demand balance update:
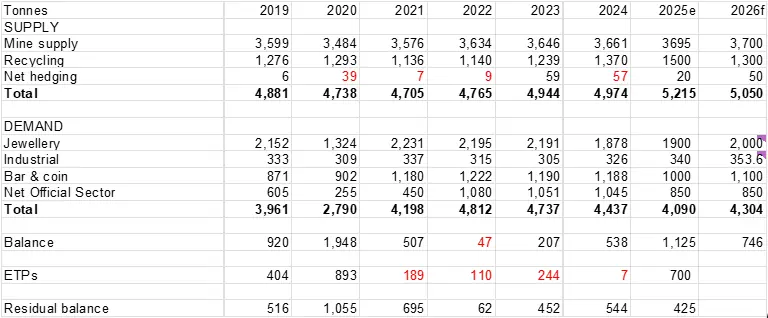
Source: Metals Focus, StoneX
Price forecast:

Repeat of the comment on 11th August
“Comment – press unwittingly overstating the gold action last Friday
All the volatility in the COMEX futures contracts (notably December, the active month) last week came about because of the following: -
A Swiss refiner asked the United States Customs and Border Protection for clarification about the tariff position with respect to 100-ounce bars and kilobars. The authority ruled that these bars should not be under the 7108.12.10 tariff (unwrought non-monetary bullion or doré) and classified into 7108.13.5500, which includes semimanufactured or powder forms and thus incurs tariffs.
At this point the futures prices on COMEX jumped, but, while the spread between spot and December expanded to just over $100 at one point, and thus hit the headlines with words like “record”, it wasn’t actually that dramatic. The average premium between spot and the active contract has averaged 5.4% since the start of 2024 and 3.1% since the start of this year. Last Friday the percentage premium was just 2.8% before sliding back to 1.7% this morning (Monday) which is where is it was last Thursday.
The White House has said that it will be issuing an executive order in the near future, clarifying the position.
Once again this raises the debate about the COMEX contract and London Good Delivery. COMEX good delivery is 100-ounces or kilobars; London Good Delivery (LGD) bars are 400-ounces. In lockdown, with so few planes flying, there was an adjustment and increased flexibility allowing for partial delivery in LGD. This was temporary however and there is an argument that the two centres should be fungible. There is also a rule in place that COMEX gold must be vaulted within 150 miles of New York City; a case could be made for easing this restriction.
Meanwhile some politicians in Switzerland are making political capital out of all this, given that it was the swelling in shipment of COMEX-deliverable metal ahead of the tariff deadline in April that bloated the trade balance between the US and Switzerland. One has even suggested that the refiners foot the bill.
The majority of US trade counterparties are now subject to 15% tariffs but there are some outliers. In China’s case it looks as if there will be a further extension of the negotiation period, possibly of 90 days.
Some of the rates that have hit the headlines include 30% on South Africa, 35% on Canada (Trump has implicitly tied this into Canda’s recognition of Palestine as a State); 39% on Switzerland (see above), which has raised some hackles, 40% on Libya, 35% on Iraq and 40% on Laos”.
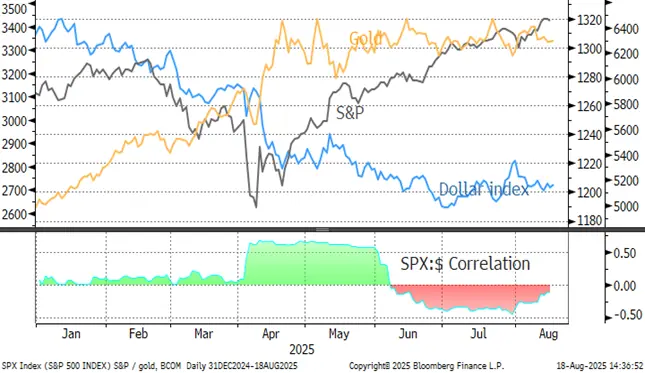
The S&P, gold and the dollar
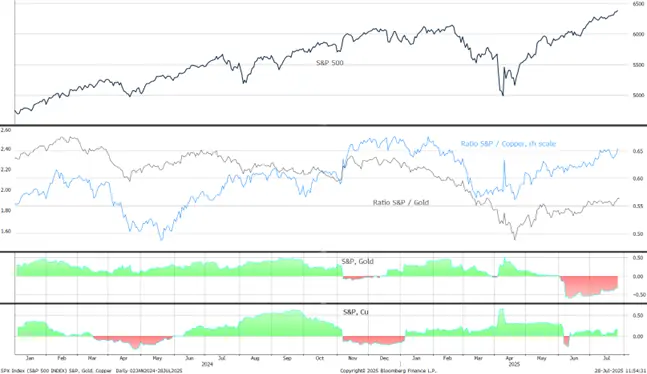
The S&P/Gold and S&P/Cu ratios
Gold, one-year view; still in a worryingly narrow band
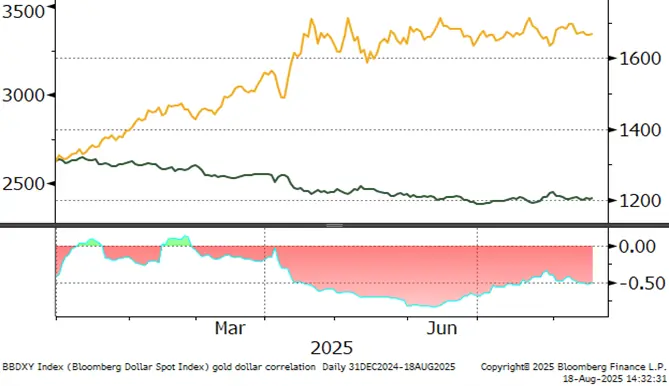
Gold:dollar correlation; tightening again; now at-0.48
Source: Bloomberg, StoneX
Silver, one-year view; resistance at $38
Source: Bloomberg, StoneX
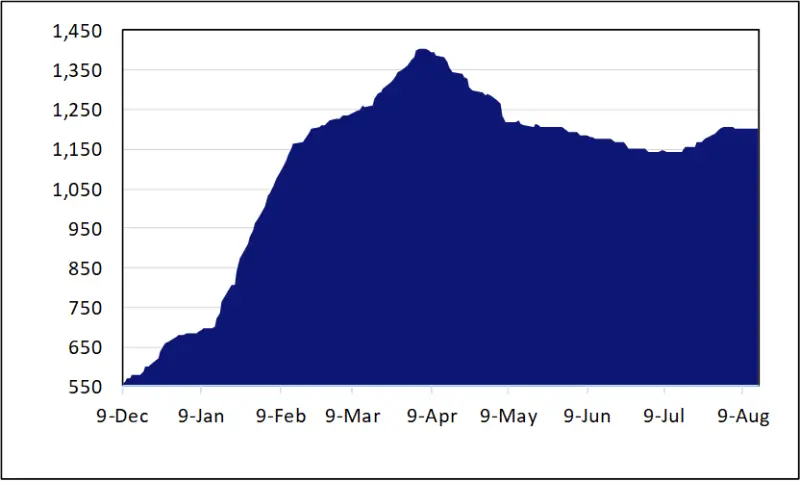
COMEX gold inventories, tonnes
Source CME via Bloomberg, StoneX
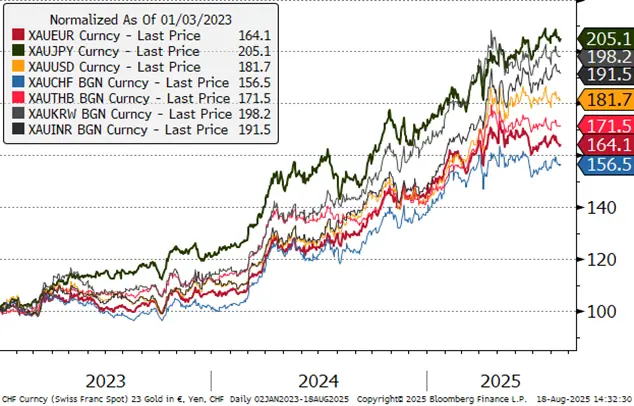
Gold in key local currencies
Source: Bloomberg, StoneX
Gold:silver ratio, January 2024 to-date
Source: Bloomberg, StoneX
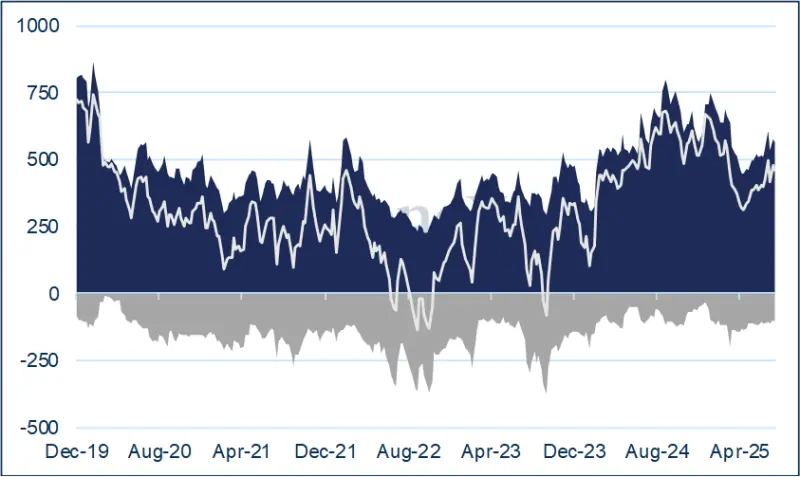
Gold COMEX positioning, Money Managers (t) –
COMEX Managed Money Silver Positioning (t)
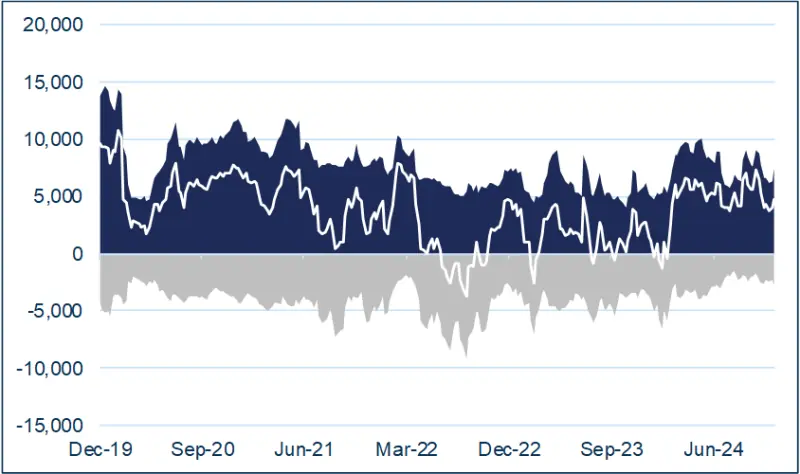
Source for both charts: CFTC, StoneX
ETF
Silver: The Bloomberg figures suggest that the net ETF creations in H1 2025 were 1,761t, of which 989t were in June. In other words, 56% of the net gains to that point were in June. Looked at another way, on an unweighted annualised basis, June uptake would be equivalent to 11,864t, or the equivalent of five months’ silver mine production. Activity has been mixed since, but the balance has been favourable with net additions of 541t in July to 24,602 and a further 93t in the first eleven trading days in August, according to Bloomberg. World mine production is just less than 26,000t.
Gold: the latest figures from the World Gold Council, up to 8thAugust, show a solid increase of 14.7t in one week, taking global holdings to 3,652.0t with gains of 81.6t to 1,887.1t in North America, but small falls in Europe and Asia to 1,374.9t and 319.8t respectively... Bloomberg figures (not as extensive) imply a gain of 16t since then, but this is only approximate. World gold mine production is 3,661t (Metals Focus figures).

Source: Bloomberg, StoneX