Apr 2024
Apr 2024
Weekly roundup for StoneX Bullion
By Rhona O'Connell, Head of Market Analysis
- Gold is consolidating, as needed
- Although silver is looking somewhat vulnerable
- Asian gold demand remains strong
- The Shanghai premium is coming down but this is financially driven rather than fundamentals…
- …as China starts Quantitative Easing
- Inflation numbers in the States were gold-friendly last week
- CFTC figures show continued reduction in the net gold long in the week to last Tuesday, but not by much; silver went the other way
Outlook; gold is in a much-needed period of consolidation and it looks clear that the previous “ceiling” in the price is now a “floor”. Both metals may have scope for further slippage, but the overall longer-term prognosis remains positive, if not outright bullish.
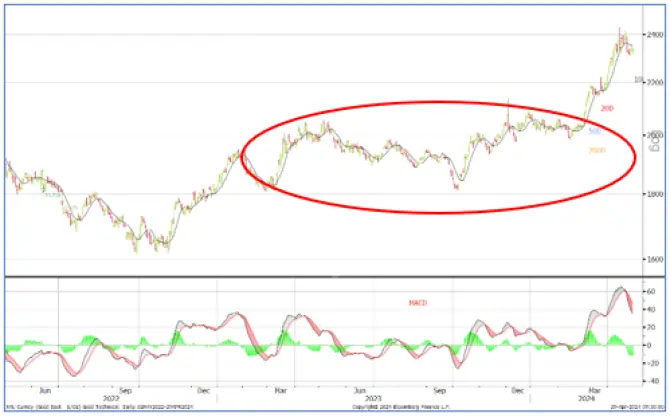
Gold, year-to-date; technical
Source: Bloomberg, StoneX
Gold has completed the first Fibonacci retracement to $2,289. The next support level is $2,197. The MACD (Moving Average Convergence/Divergence) remains negative. This is a popular technical measure and could well indicate further slippage in spot prices.
Key drivers are still geopolitics and central bank policy, with the added spice this time of Quantitative Easing (i.e. bond buying) in China, in what looks like a fresh effort to stimulate the domestic economy and this has the potential to support the exchange rate and with it, local gold demand. At the professional level the Shanghai Futures Exchange increased its margins for gold and silver (and copper and aluminium) contracts last week, which may help to keep gold and silver prices quiet until the markets have adjusted. The new hedging margins are 7% for gold and 8% for silver; for speculative positions, 8% gold and 9% silver.
Meanwhile gold retail demand remains robust in Asia.
In the United States the impact of the inflation figures last week shows just how much sentiment has changed in the gold market. In 2022 and much of 2023, high inflation figures rattled gold as the market expected the Fed to react accordingly, with rate hikes. Last week the core Personal Consumption Expenditure index (core PCE), which is one of the Fed’s most closely watched parameters, came in at 2.8% year-on-year for March, above market expectations. This, on top of rising personal spending levels, was enough to give gold a boost, whereas a year previously that would have been the other way round.
The US GDP numbers were a lot lower than expected, but independent economists have said that the numbers were nowhere near as bad as the headlines suggest, arguing that falling inventories and volatile trade had acted as a drag, while other sub-components were robust.
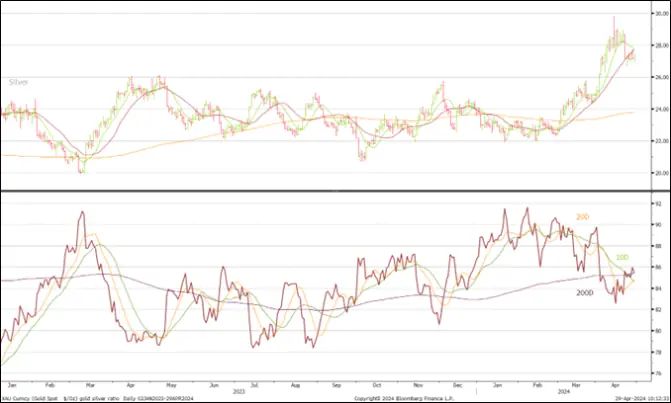
Even so those GDP figures may have put some pressure on silver, which is currently seeing only patchy demand and the ratio is rising; the technicals for the ratio are also turning down. Further, the 10—Day moving average for silver itself is about to drop below the 20D, which is also negative.
Spot silver; gold:silver ratio
Source: Bloomberg, StoneX
The next Federal Open Market Committee meeting is this week, Tuesday/Wednesday April 30th /May 1st . This does not include Special Economic Projections; for those (and the dot plot) we need to wait until the meeting on June 11th and 12th.
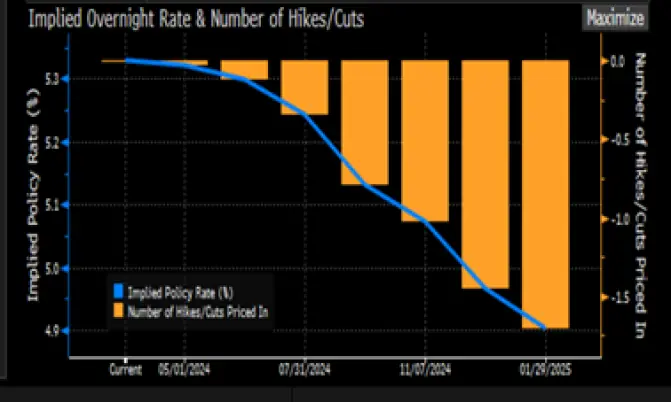
Bond markets expectations for the rate cycle; 45% chance of a cut in September and looking for rates below 5% by year-end
Source: Bloomberg
In the background the gold and silver Exchange Traded Products showed the same patterns last week. Both metals saw some chunky buying as prices came down early in the week and then a little more bargain hunting later on, interspersed with smaller-scale sales. Gold thus lost three tonnes, taking net sales so far this month to ~31t, for a year-to-date fall of 143t (world mine production is roughly 3,700tpa). Silver added 105t in the week for a net loss of 392t in April so far and a year-to-date loss of just 29t (global mine production is ~26,000tpa).
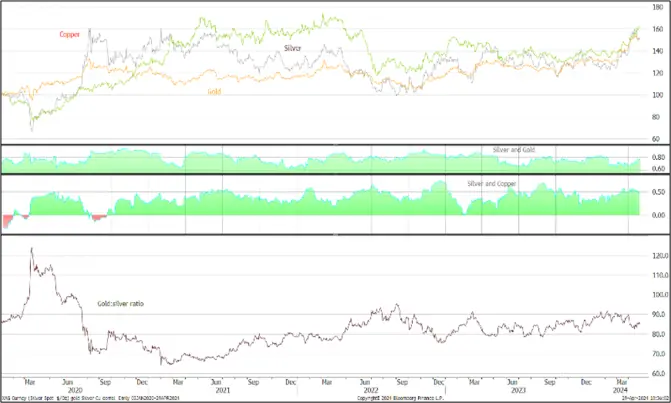
Gold, silver and copper; silver correlation with gold, 0.76; with copper, 0.46
Source: Bloomberg, StoneX
The Commitments of Traders report for 23rd April, when gold had slipped to $2,330 after meeting consistent resistance at $2,400, saw a 15t drop in the outright long to 528t, while shorts expanded by 7% to 109t from 102t. This took the net long to 419t, down from 441t the previous week. The outright long, at 543t, is 29% over the 12-month average of 409t.
Silver was different. Spot had met resistance at $30 and then again at $29, and sustained a sharp drop on the 22nd itself, falling from $28.60 to $27.20; it looks as if the early challenge at the higher levels was driven by short covering, especially as there was no follow-through. That sharp fall at the end of the period looks to have enticed some bargain hunting, with outright longs rising by 1% over the week to 9,717t while shorts contracted by 12% to 3,256t. This leaves a net long of 5,890t with the outright longs still looking too toppy at 56% over the 12-month average.
Gold COMEX positioning, Money Managers (t)
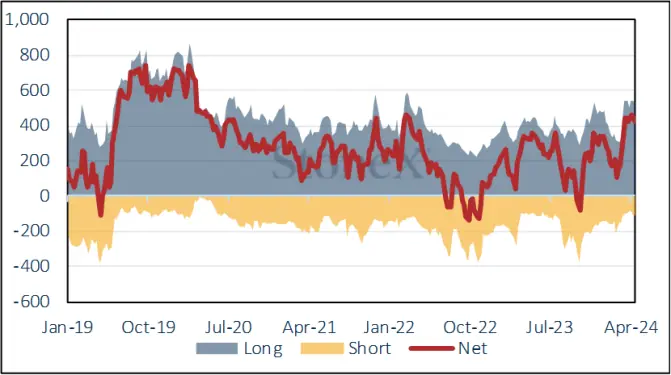
Source: CFTC, StoneX
COMEX Managed Money Silver Positioning (t)
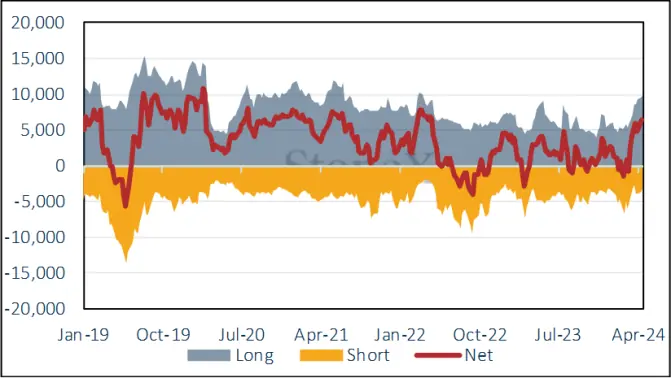
Source: CFTC, StoneX

Source: Bloomberg, StoneX