May 2024
May 2024
Weekly roundup for StoneX Bullion
By Rhona O'Connell, Head of Market Analysis
- US numbers last week affirmed the slowing tendency in the economy and easing inflationary forces, but it is still too high for the Fed.
- Although the Fed will want more, gold prices sprang to life, aided by strengthening bullish technicals
- And the febrile nature of the markets meant that the tragic news of the air crash in Iran that killed the President and the Foreign Minister gave prices a further boost
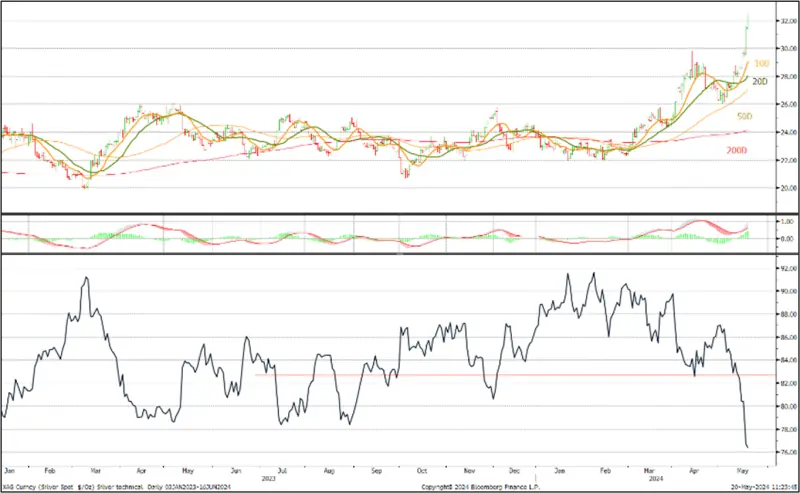
- Silver is joining in with a vengeance and has cleared $31
- And since last Thursday’s close gold has gained 2.9%; silver is up by 8.3%
- And the ratio has dropped from 80.0 to 76.4; next support level 71.4
- Gold at an all-time nominal high, but 39% off the peak in real terms
Outlook; last week we wrote as follows:
“The consolidation around $2,300 and $27.0 have given gold and silver support and laid the foundation for the recent jump; we remain positive towards both, but would expect steady improvements rather than spikes, barring any Black Swans”
This week we have had just such a spike, while the background factors remain supportive. Both metals need to correct in the short term, of course, but this move is confirmation of the change in range for both metals.
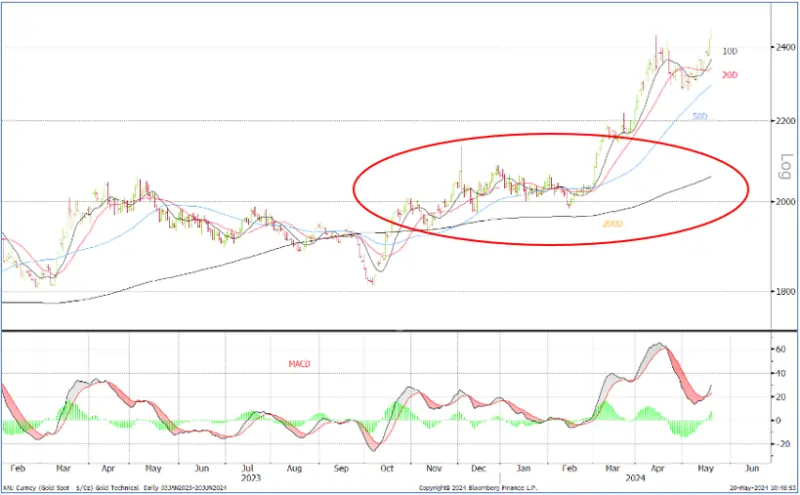
Gold, January 2023-to-date; technical: unwinding from overbought and the 10D and 20D MA are neutral
Source: Bloomberg, StoneX
The ten-day moving average crossed above the 20D last Tuesday 14th, adding fresh support augmented by the MACD turning positive on the same day; MACD is widely followed
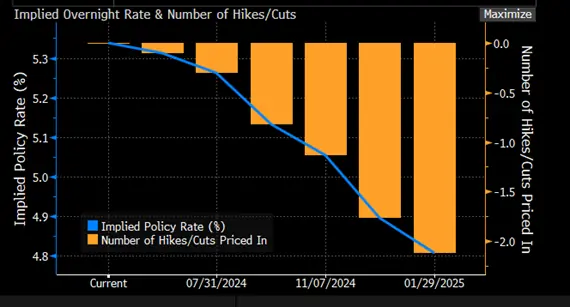
Last week saw inflation numbers in the United States that at the CPI level were lower month-on-month, although the PPI was fractionally higher (although this may be due to a couple of outliers). While still too high for the Fed’s comfort, the trend is in the right direction. The Fed is still very cautious, however, and is most unlikely to take just this set as a justification for near-term rate cuts. That said, the figures have raised expectations about a cut in September (meeting is 17-18th; the next meeting is June 11-12, then July 30-31), which is also the next meeting that carries the Special Economic Projections and the Dot Plot, in which each member of the Committee marks their expectation for fed funds at the end of this year, next year and the longer term.
Bond markets’ expectations for the rate cycle; now pricing in a 52% chance of a cut in September and looking for rates below 5% by year-end
Source: Bloomberg
The Producer Price Index posted a monthly gain of 0.5% after 0.2% in March and ahead of market expectations, but this may prove to be a one-off. Energy goods were especially strong and final demand services were much higher than previously with, for example, trade services up 0.8% M/M and trade in private capital equipment posting a 3.9% gain after minus 2.1% in March. At the CPI level, a number of foodstuffs prices were in negative territory, alongside soft retail sales. Core CPI was 0.3% month-on-month but on an annualised basis it was 3.4%, which is still way too high for the Fed.
Spot silver; gold:silver ratio
Source: Bloomberg, StoneX
In addition there is a mildly cautionary tone from the April Consumer Expectations Survey from the New York Fed. This showed rising inflation expectations for the short and longer-term, although lower in the medium term. Median expectations for one-year inflation (and expectations are important – note the emphasis that Central Bankers put on keeping expectations anchored) rose to 3.3% from 3.0%, and to 2.6% from 2.6% for the five-year horizon. For three-years the result was 2.8% from 2.9%. Home price expectations were at the highest level since July 2022 at 3.3% after seven consecutive months at 3.0%, although this is shortage of supply rather than rampant demand.
Credit conditions continue to tighten in the United States, as they do in Europe in the banking and non -banking sector and at European households. The Latest European Central Bank Stability Report notes that while vulnerabilities have eased, the outlook remains fragile. And in China the Government’s net bond sales shrank in April while aggregate financing contracted by $27.7 Bn (Bloomberg calculation); this is reportedly the first time this measure has fallen since the data series started in 2017. This is another feature that will support gold, reflecting as it does the poor state of sentiment at both a corporate and household level, stemming in large part from the continued weakness in the property sector, although industrial demand is improving.
In the background the gold Exchange Traded Products have started seeing some interest. Of the 13 trading days so far in May gold has had only six days of net creations, but four of those have been in the past four days. Volumes have been cautious, totalling 7.8t over those four days and taking net sales to six tonnes in May, for a year-to-date fall of 161t to 3,064t (world mine production is roughly 3,700tpa). Silver has seen just two days of net creations and these were all small; the past six days have all been net redemptions, leaving the month to date with a net loss of 324t to 21,376t. Year-to-date the loss is 393t. (global mine production is ~26,000tpa).
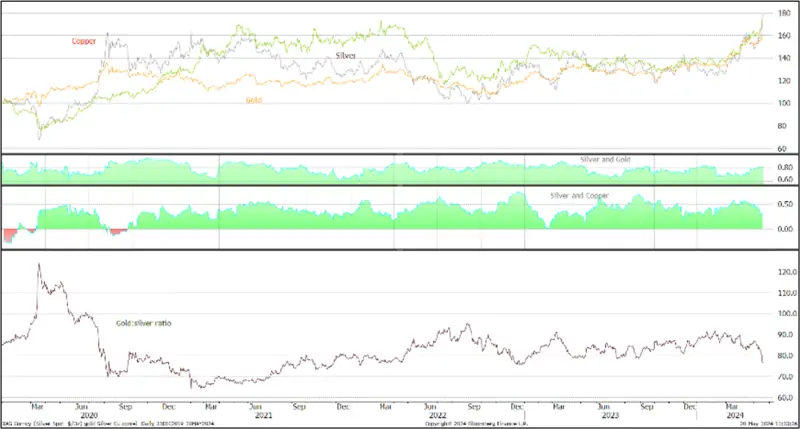
Gold, silver and copper; silver correlation with gold, 0.81; with copper, 0.28
Source: Bloomberg, StoneX
COMEX; sentiment cools
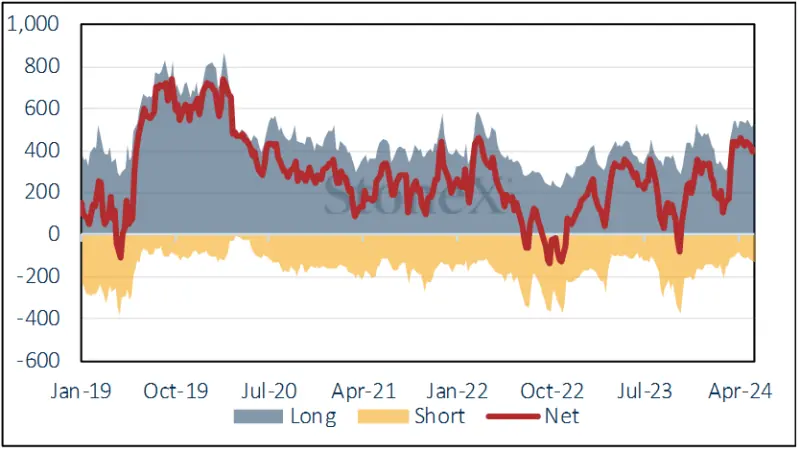
The Commitments of Traders report for the week to 14th May during which time gold rose to $2,378 from $2,314, eased to $2,333 and then started the next bull leg, saw a 4% gain in longs and a 7% gain in shorts, to 535t and 129t respectively, bringing the net position down to 392t long, the lowest since early March. The outright long, at 535t, is 28% over the 12-month average of 409t, so it continues to decline, but is still toppy. After the price moves of the past couple of days it is probably even larger.
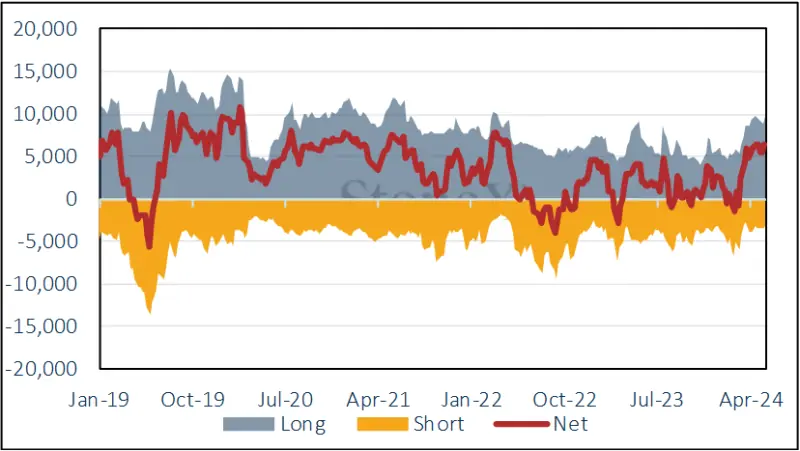
Silver’s price was mildly bullish, opening the period at $27.27 and closing at $28.60. Longs expanded by 10% to 9,678t and shorts were still effectively flat at 3,297t. This leaves a net long of 6,381t with the outright longs still looking too toppy at 54% over the 12-month average.
Gold COMEX positioning, Money Managers (t)
Source: CFTC, StoneX
COMEX Managed Money Silver Positioning (t)
Source: CFTC, StoneX

Source: Bloomberg, StoneX