Jan 2024
Jan 2024
StoneX Bullion round-up Monday 29th January 2024
By StoneX Bullion
Gold is now consolidating above $2,000; upside still favoured but not yet
- Gold outlook remains positive for this year, due to a range of uncertainties. Spot is trading at $2,030 as we write after gaining $10 on news of the Evergrande liquidation.
- In our last note, a week ago, we suggested that gold needed some time to consolidate; it is doing so
- For the time being market stakeholders are neutral
- Physical demand remains strong in China ahead of the New Year, backed up by trade flow information
- China’s silver exports marginally higher in 2023 than 2022
- Silver ripe for a short-covering rally?
- Ø The markets are now pricing in no US rate cut in March and a 50% change of a 25-pt cut in May
As with last week, gold and silver market sentiment remains cautious but the geopolitical and financial environments are gold-friendly. Silver is still cautious on the back of uncertain economic projections despite a healthy long-term horizon, but showing signs of life.
News of the Evergrande liquidation order hit the BBC this morning (Monday) This still talks to my soap-box theme about endemic risks in the banking system (via the link to property infrastructure in China and the CRE issues in the States). One of my key themes for arguing a mild gold bull case this year, The news put $10 on gold. A muted reaction but gold doesn't want to commit one way or the other at present. Tailwinds trump headwinds though
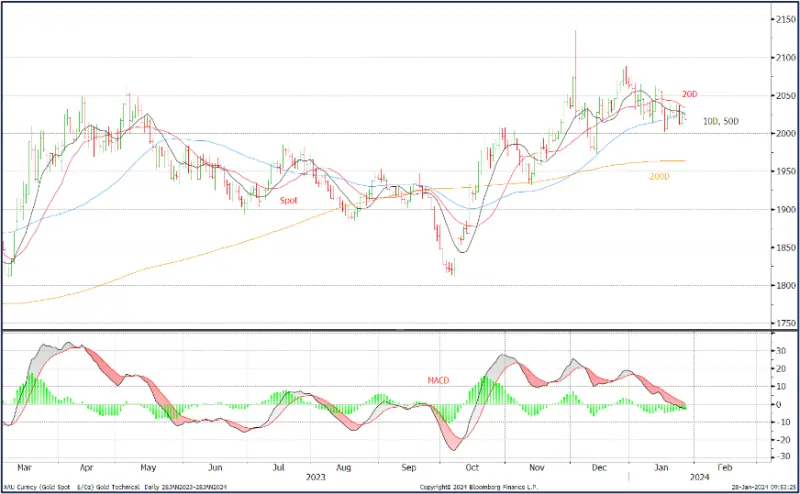
Gold technical, six months view; mixed. Spot is below the 20D MA, 10D and 50D are coinciding with spot. MACD (a key short-term indicator) is still negative
Source: Bloomberg, StoneX
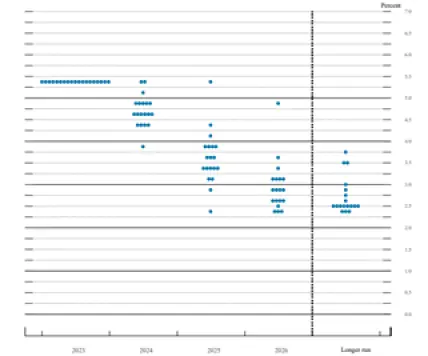
FOMC fed funds rate projections
December
Source: The Federal Reserve
Source: Bloomberg
After reversing at $2,050, gold has traded in a narrow range over the past few days, between $2,011 and $2,040, last (at time of writing) at $2,020. Professional participation has been relatively quiet as there were so many economic numbers due to come through last week in the United States, to be followed by the January meeting of the Federal Open Market Committee (FOMC) on30th and 31stJanuary. This meeting does not produce Special Economic Projections (and therefore not a dot plot), but the Statement and the Press Conference will be interesting as following those numbers last week (see below) the markets will be looking for any nuance. We believe that the Fed will maintain a cautious policy as it is axiomatic that most central banks run scared of cutting rates or loosening policy too soon, for fear of re-igniting inflation. The markets (see above chart) are pricing in a 50% chance of a 25-basis point cut in May, but there are so many uncertainties in the environment at the moment (and we must not rule out the potentially inflationary implications of the hostilities in the Red Sea and the impact on trade flows) that in our view a cut in May looks unlikely.
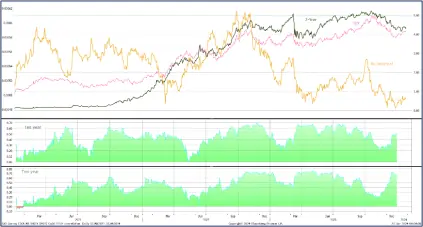
Gold and the two-year and ten-year yields, January 2021 to date
Source: Bloomberg, StoneX
The best encapsulation of our reaction to last week’s figures comes from our Chief Market Strategist Kathryn Rooney Vera, who noted after the PPI numbers (Thursday) that “In my view, either the GDP deflator accelerates, or 10 yield UST yields continue to fall. Check out the historical relationship between the GDP deflator, core PCE, and the USGG10 year. This is [in my opinion] why the fixed income market liked this print despite it blowing out all forecasts. Either the GDP deflator accelerates, or Treasuries yields fall”.
This chimes with this writer’s view that US economic numbers are still tailwinds for gold. Not necessarily outright bullish in the short term because of the different market forces in play, which are keeping sentiment cautious, but in the medium term they should favour gold’s upside.
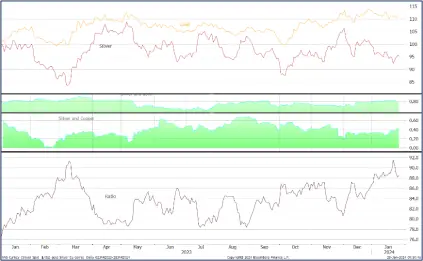
This also points to better silver prices. For most of the latter part of last year, even with gold gradually working higher, silver was cautious in the face of economic uncertainties and while the broad price patterns were similar, silver underperformed gold. This is not the norm, due to silver’s higher volatility of the two, and suggests a) that the markets overall were not convinced that gold had solid upside potential and b) that investment activity was under a cloud in the face of the higher cost of capital, which raises mortgage interest rates and eats into disposable income. Consumer confidence in both the United States and Europe is still cautious, although there was an improvement in December, which may suggest that the tide is starting to turn. One set of data points, though, is not enough to make that call.
Gold silver and the ratio; silver’s correlation with gold and with copper
Source: Bloomberg, StoneX
At the start of this year silver has started to catch up with gold, which also potentially points to an underlying shift in sentiment.
So, what were those all-important numbers last week?
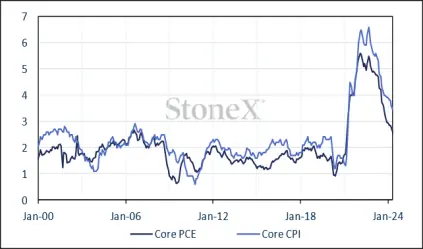
In summary; the US GDP deflator, which covers goods and services in the GDP and which is therefore wider than the Core Personal Consumption Expenditure (which is one of the Fed’s key focuses when determining monetary policy) came in at 1.5% after 3.3% previously, pointing to solid but not rampant real growth. The core PCE was released the following day and at 0.2% month-on-month and 2.9% year-on-year was in line with market expectations. Personal spending, as noted above, exceeded expectations and areas of notable strength on a month-on-month basis, including the auto sector (both vehicles and trucks), which is counter to the recent trend. Whether it heralds a change in direction is too early to tell.
It is also interesting to note that consumer spending accounted for over half the GDP growth in the quarter and also that household savings do not appear to have been run off to any great degree. This latter point would certainly argue for the Fed maintaining the “higher for longer” policy. The Fed is maintaining its data –dependency; the January meeting has only one set of economic data to consider, but in March they will have two. And of course March is the first meeting to provide Special Economic Projections, including the new Dot Plot.
It is also worth nothing that the European Central Bank met last Thursday and as expected, held its key interest rates steady and repeated the comment about the need for rates to be held “for a sufficiently long duration” to achieve the 2% inflation target.
The Council noted that apart from an energy-related boost, the inflation decline had continued, with tight financing conditions “forcing down demand”. Backing this up is the latest Consumer Confidence reading, which was minus 16.1 in January and points to further slowdown. So this also talks to reduced retail gold and silver demand in Europe in the near term as disposable income remains under pressure and low confidence is dictating caution.
So more of the same in price terms for now, but with potential for improvement in both metals as the year wears on.
Silver technical; back into the uptrend, the moving average conformation is neutral to bearish, as is the MACD
Source: Bloomberg, StoneX
Exchange Traded Products
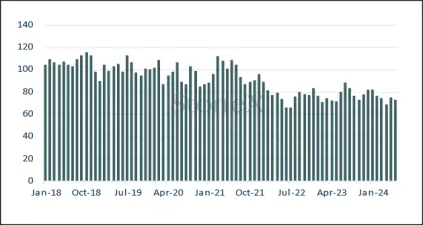
In the ETP sector, the latest numbers from the World Gold Council (the most reliable source) showed a fall of 244t in 2023 (for a funds exodus of $14.7Bn) to 3,226t. World mine production is roughly 3,650t. The Council’s tonnage numbers for this year so far only go to 19thJanuary and show holdings of 3,185t, implying a drop of 41t. Bloomberg numbers for the following week show five consecutive days of net redemptions and suggest a further fall amounting to 11t for a month-to-date decrease of 52t.
Silver ETPs have also generally been in the red although one day last week saw a hefty injection of 495t. For the year to date, though, there have been only six days of net creations (from a total of 20) for a gain of 271t to 22,041t. Over 2023 as a whole the silver ETPs dropped from 23,296t to 21,770t (world mine production is approximately 26,500t). This was therefore a fall of 1,526t, equivalent to three weeks’ global mine production.
Futures positioning;
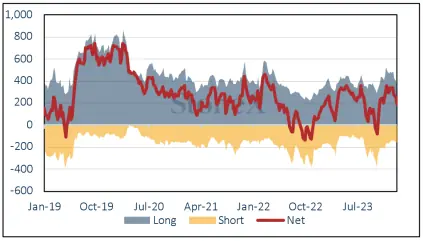
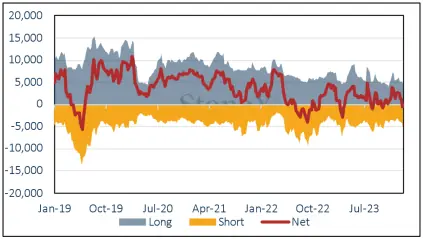
From the start of the year through to 23rd January gold and silver have remained under a cloud on COMEX. Last week gold saw more long liquidation and a small number of fresh shorts (longs down 61t to 15% and shorts up eight tonnes or 5%) leaving the net position at 190t long against a 12M average of 190t. Silver longs dropped by 7% and shorts rose by 26%, taking the outright long position down to 4,732t ( a fall of 1,445t or 23% year-to-date) and shorts to 5,157t, the largest outright short position since mid-October and taking the net position from 1,000t to a net short of 427t, compared with a 12M average of 1,541t and potentially opening up the way for a short-covering rally.
Gold COMEX positioning, Money Managers (t)
Source: CFTC, StoneX
COMEX Managed Money Silver Positioning (t)
Source: CFTC, StoneX

Source: Bloomberg, StoneX