Jun 2025
Jun 2025
Silver ETFs Surge as Gold Faces Correction
By Rhona O'Connell, Head of Market Analysis
Gold now below $1,400 again on easier geopolitics and again unwinding overbought conditions; silver the outperformer over the week
- Silver ETFs have massive inflows in June of more than 925t, accounting for 55% of the year-to-date net creations
- Annualised, June silver ETF uptake would be 11,107t or an uplift of 50% from end-2024 levels.
- Gold had a much-needed selloff at the end of last week
- The fall was $102 or 3.1%, driven in part by reports that much of the US-China trade agreement had been signed
- Technically it is close to completing a double top with the neckline at $3,200
- Chinese demand is still slow (apart from interest in bars)
- And this again underpins our view that the market is crowded and that the high is in
- Silver fell by less; at 2.5% which is unusual – normally we would expect a fall of twice the percentage of gold
- This likely reflects a continuation of the rotation out of gold into the white metals
- But possibly also the constructive long-term outlook
- As noted last week, “Bullion” is exempt from tariffs, but the markets remain jumpy; all eyes on 9th July with the markets also waiting to see whether the PGM qualify as bullion for these purposes
- Gold ETFs though are enjoying a purple patch
- Caution: retail investment remains flat for both gold and silver
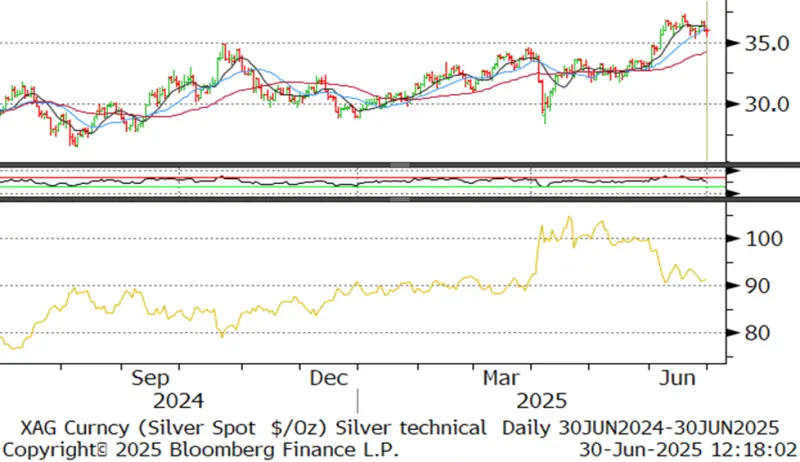
- Outlook: unchanged. The gold:silver ratio is stabilising between 91 and 95; the easing in the Middle East and the US-Sino signing both reduce tensions and therefore work against gold but potentially help silver. For the much longer-term silver has a robust fundamental outlook but for now it is stabilising around $36 – although it is arguable that it is forming a head-and-shoulders formation which, if completed, could precipitate a fall towards $33.20. As we noted last week, gold’s reactions to previously supportive developments had been increasingly guarded and the continued correction in milder conditions underpins our view that the high is in.
Comment
Today I include comments from our Senior Advisor Jon Hilsenrath who has extensive experience covering the US economy, having previously spent some years on the Wall Street Journal. His tariff / inflation comments at the end of last week include the following: -
“THE GOOD NEWS:
Through May, there is no evidence in the macro data that tariffs are pushing up the national inflation rate. The Fed’s favored inflation data — the personal consumption expenditure price indexes — were released today and show this once again.
THE NOT-SO-GOOD NEWS:
Inflation remains slightly above the Federal Reserve’s 2% target. During the summer, comparisons to last year will be tough. The U.S. delivered soft inflation data last year, which means the year-over-year readings that the Fed watches will make it harder to get inflation back to 2%, even if tariff effects aren’t that large.
MY CONCLUSION:
For many months, economists have been upside down in their description of tariff effects on inflation. They describe tariffs as a one-time price shock that show up in short-term data, without long-term effects. I look at it another way. I see muted short-run effects and long-run upward pressure on consumer price levels.
The short-run effects are muted because:
A) Business has had time to prepare and buffer itself, for example by building inventories to minimize short-term effects;
B) Consumers adapt and switch spending when they see one price category go up. You get some relative price changes, costs go up in one area and down in others, but not broad price changes;
C) Tariffs get eaten elsewhere in the supply chain before reaching consumers, including corporate profit margins, and, yes, foreign suppliers. China is taking some of the bite. The evidence: China’s producer prices are going down.
Tariffs push up long-run inflation. The globalization era delivered three decades of falling inflation rates and deflation in the goods sector most affected by imports. It is logical that taxing the global supply chains that produced lower inflation in the long-run will have the opposite effect.
Today’s data fit this narrative, so I’m sticking with it. For the Federal Reserve, this means it might cut rates in the months ahead, but it doesn’t have room to cut them a lot more without stirring inflation demons. The next Fed chairman, whomever President Trump chooses, will at some point need to confront these realities. The next chairman will be in a state of constant tension between protecting his own legacy to avoid inflation and managing the president’s contradictory desires”.
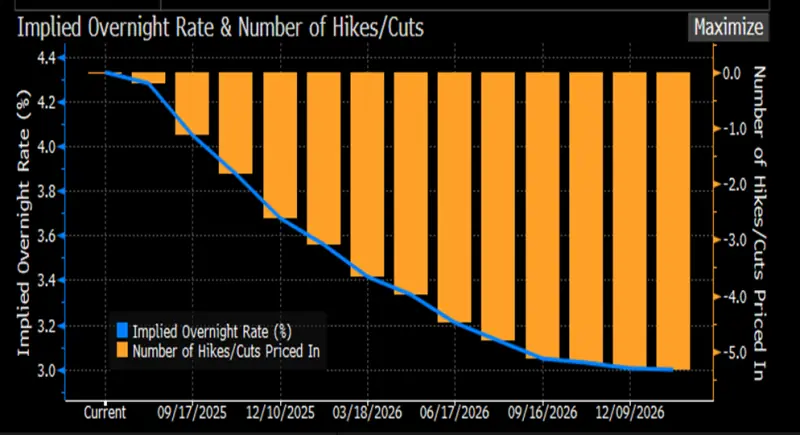
Bond markets still pricing in two cuts by year-end
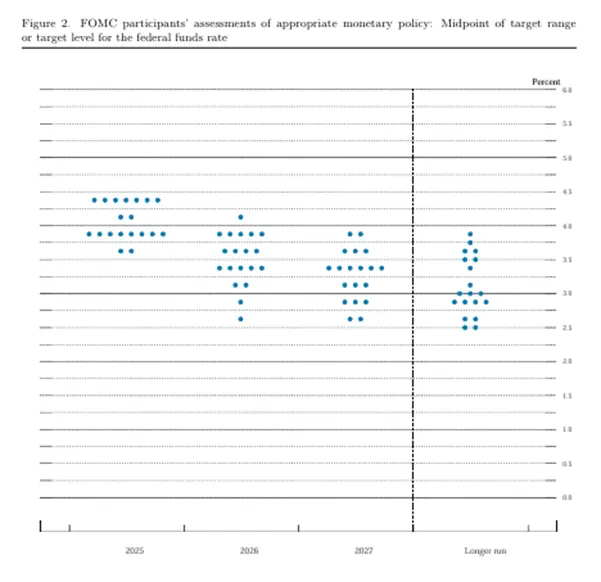
June dot plot
Gold, one-year view; continuing to drift lower, increasingly muted reactions to financial fluctuations
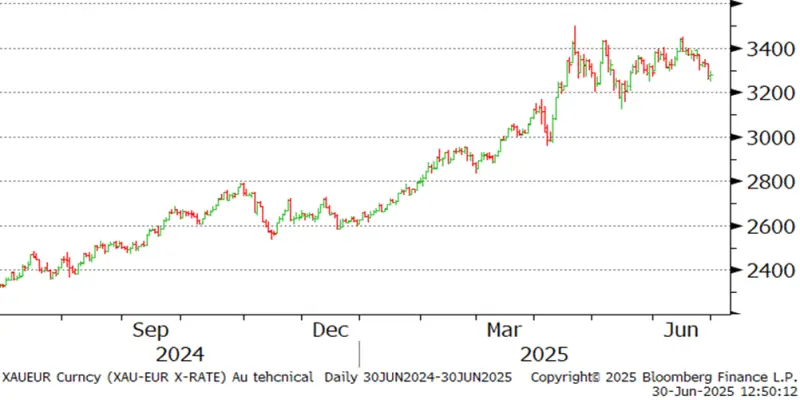
Gold:dollar correlation; lower at 0.67

Source: Bloomberg, StoneX
Silver, one-year view; narrow ranges, based on either side of $36 – a fall imminent?
Source: Bloomberg, StoneX
COMEX gold inventories, tonnes
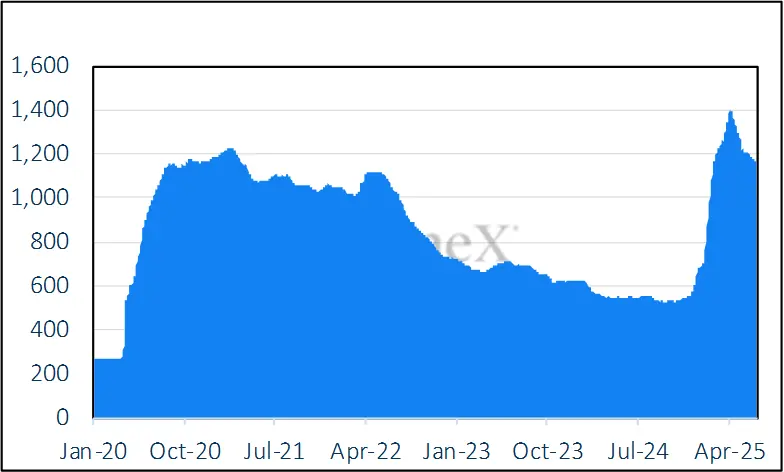
Source CME via Bloomberg, StoneX
Gold in key local currencies
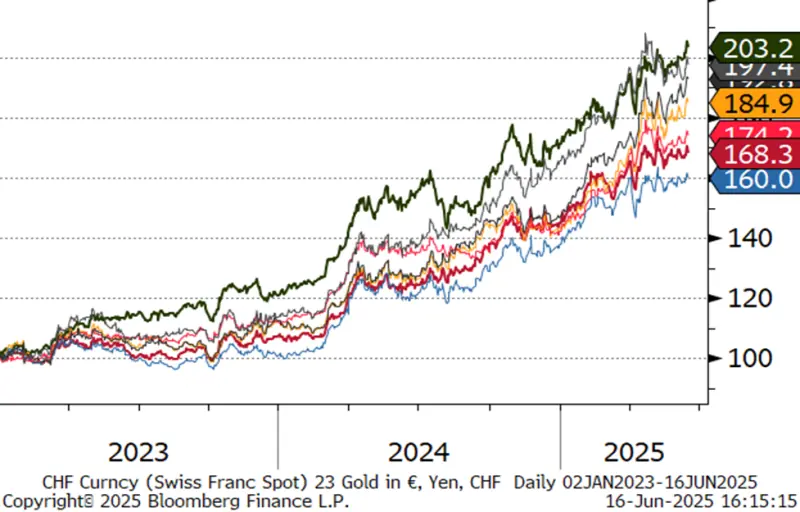
Source: Bloomberg, StoneX
Gold:silver ratio, January 2024 to-date; support at 90
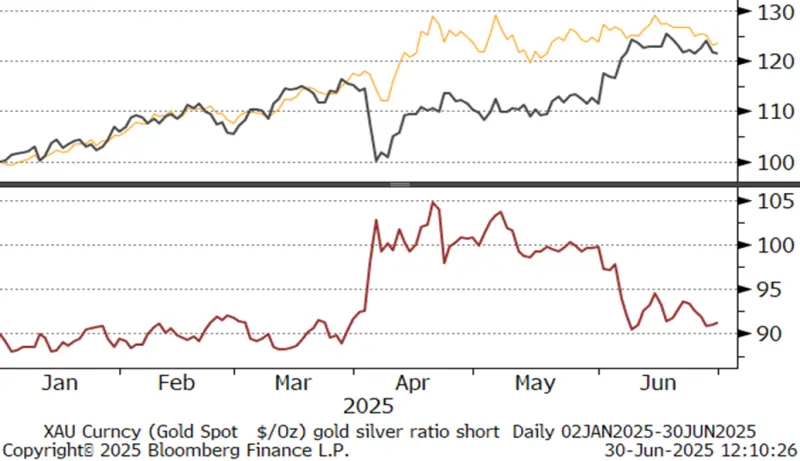
Source: Bloomberg, StoneX
Background
The latest CFTC report is that for 24th June. The previous week’s numbers were delayed as there had been a public holiday in the States. Over the period outright gold longs gained 12t to 521t then retreated to 510t; shorts gradually increased in both weeks, to 120t. Longs were 12% below the 52-week average while outright shorts are 20% above.
Gold COMEX positioning, Money Managers (t) –

COMEX Managed Money Silver Positioning (t)
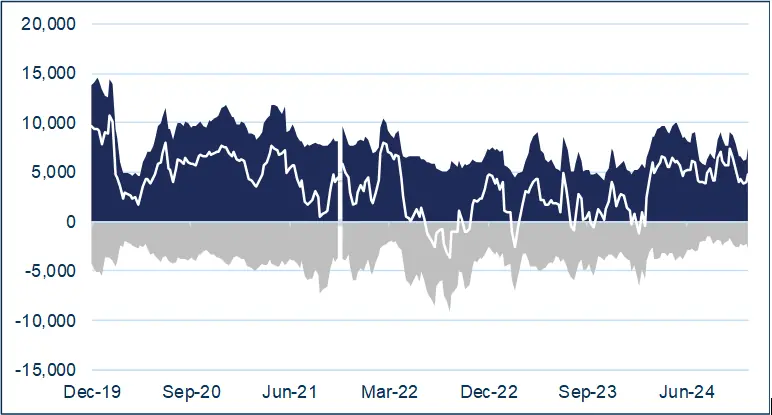
Source for both charts: CFTC, StoneX
ETF
Silver: after a solid first half of the month with an addition of 584t, the second half of June has seen sporadic profit taking. There has also been some sizeable bargain hunting, so that the second half has posted gains to date of 361t. In other words, 55% of the net gains year-to-date have been in June. Looked at another way, on an unweighted annualised basis, June uptake would be equivalent to 11,107t, or the equivalent of five months’ silver mine production.
Gold: the latest figures from the World Gold Council, for the week to 20th June, show an increase of 16t globally, with small losses in Asia, but gains elsewhere, predominantly in North America. Split: North America, 1.847t; Europe, 1,355t; Asia. 315t; and other, 71t. The Bloomberg numbers (not as comprehensive as the WGC) suggest that the following five trading days an overall increase of 34t, taking the total to roughly 390t for the year to date, to roughly 3,600t, which compares with world gold mine production of 3,661t (Metals Focus figures).

Source: Bloomberg, StoneX