Jul 2025
Jul 2025
Gold & Silver Hold Steady Amid Trade Shifts
By Rhona O'Connell, Head of Market Analysis
Equity markets exuberant but not necessarily in dangerous territory
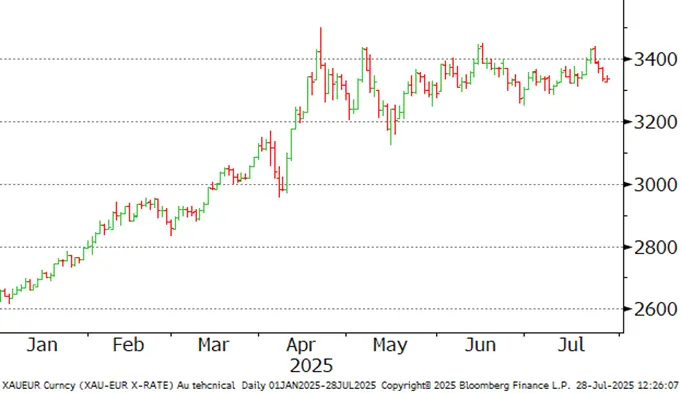
- Gold has remained in the $3,200 to $3,450 range now since April 23rd; and between $3,300 and $3,400 since end-June, slipping over the weekend as the US and EU reportedly conclude a trade deal with tariffs at 15% including autos, apart from steel and aluminium, which remain at 50% under S. 232. This deal looks similar to that with Japan and equity markets overall are still sturdy
- The three key moving averages are very tight accordingly, between $3,340 and $3,353
- Gold slipped by 2.0% between its Thursday high and the low in Asian hours this morning as trade tensions eased (Monday 28th), finding support in the $3,330 area
- A move from Israel to allow some aid lorries into Gaza would also have been an influence over the weekend
- Such narrow price ranges can often precede a break-out
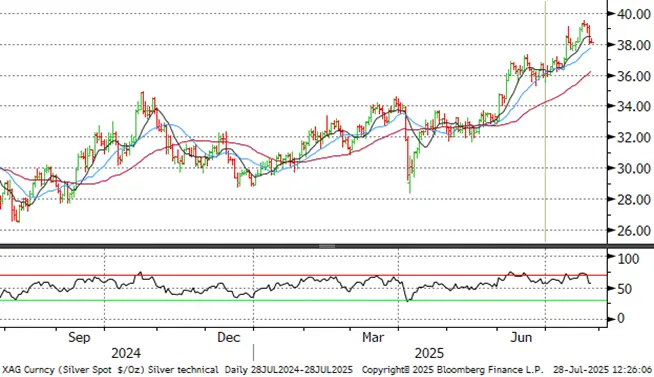
- Silver fell by 3.6% over the same period but is stabilising just above $38.2.
- Retail investment demand is quiet everywhere for both gold and silver; the Shanghai differential is flat
- Investment products continuing to be re-sold
- Gold and silver ETFs have now seen net creations for five consecutive days
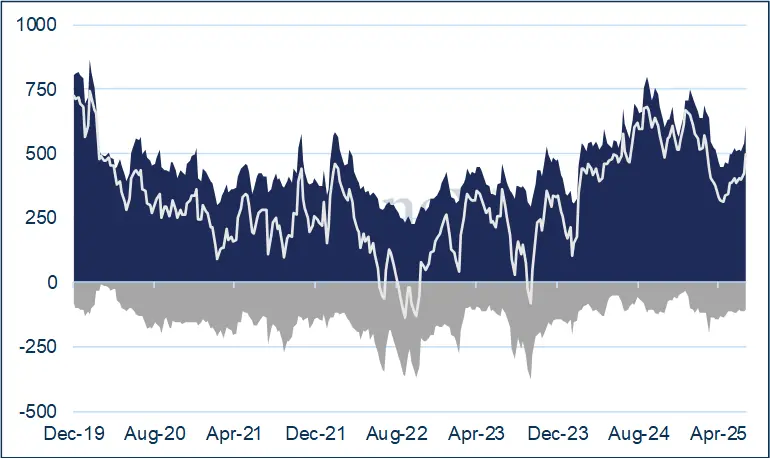
- A big jump in COMEX Managed Money took gold longs to the highest since 8th April
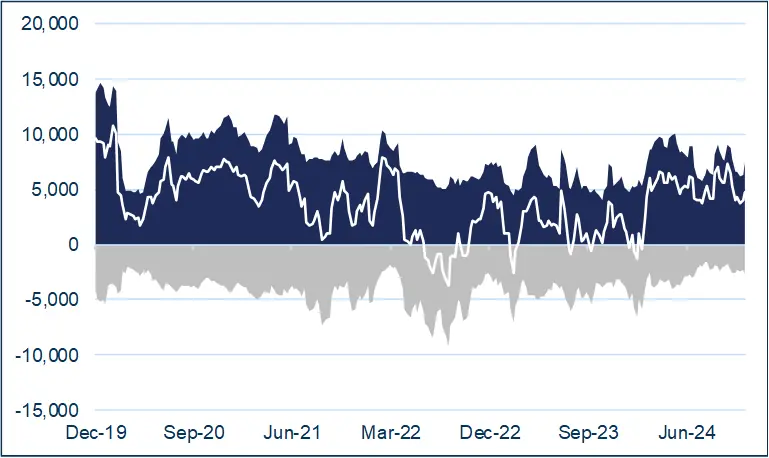
- While silver was also positive but to a much lesser degree
- The Fed meeting is this Tuesday and Wednesday; the Fed has been in black-out period since the 19th
- No rate cut expected, with the US labour market solid, although the Manufacturing Purchasing Managers’ Index has dipped below the neutral level of 50
- The President continues to pressure the Fed to cut rates, but is not now talking of firing Chair Powell
- And it is important to remember that the FOMC is a 12-strong Committee, not just one man
- The European Central Bank met last week; no rate cut and a mildly hawkish tone. EU inflation is currently 1.6% against a 2% target so a September rate cut is now in the balance
- Silver ETF’s massive inflows in June of 989t reversed in early July; profit taking appeared on approaches to $40, but heavy ETF buying re-emerged last week and would have helped silver mount another challenge on $39
- As noted earlier this month, we expect silver to post a pre-investment surplus of 2,700t this year (five weeks’ fabrication demand), but heavy investment activity (bullion and ETF) will take it into a deficit, quite possibly approaching the equivalent of ten weeks’ global fabrication demand
- And as noted previously, “Bullion” is exempt from tariffs, but the PGM markets remain jumpy, and silver has tightened; all eyes now on 1st August with the markets also waiting to see whether the PGM qualify as bullion for these purposes
Outlook: unchanged. For the much longer-term silver has a robust fundamental outlook but for now it is stabilising above $36 with Fibonacci resistance now lower than last week, at $38.77. Gold is unwinding some of its long-standing risk premia, but the economic and political environment remains constructive; the technicals on the chart point to support at $3,295.
Comment
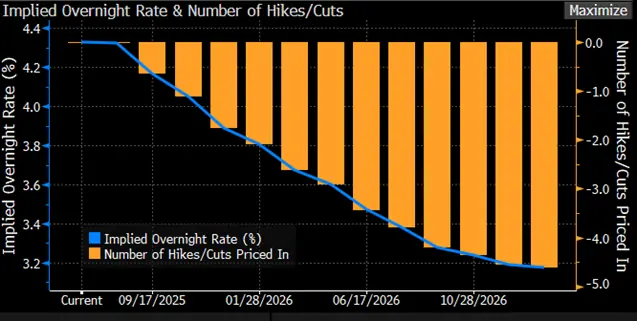
Bond markets still pricing in two cuts by year-end; Fed unlikely to cut before Sepetember, if then
Source: Bloomberg
In the short term the result of the trade deals with the EU and Japan are giving further support to the equity markets, even though the EU members are not unanimously happy with the terms of the deal.
Tariff latest:
The President had originally threatened the EU with 50%, then came down to 30%. The agreement is for 15% on the majority of goods. Steel and aluminium are currently, under S.232, levied with 50% tariffs. Japan has struck a similar deal, but the Nikkei has given back some of last week’s gains. It looks as if the US-China deadline may be pushed back by another 90 days. Senior officials are meeting in Sweden this week with the Chinese Vice-Premier and US Treasury Secretary leading their respective delegations. Tariffs will be part of the discussions along with trafficking of Fentanyl, and Chinese buying of Russian and Ukrainian oil.
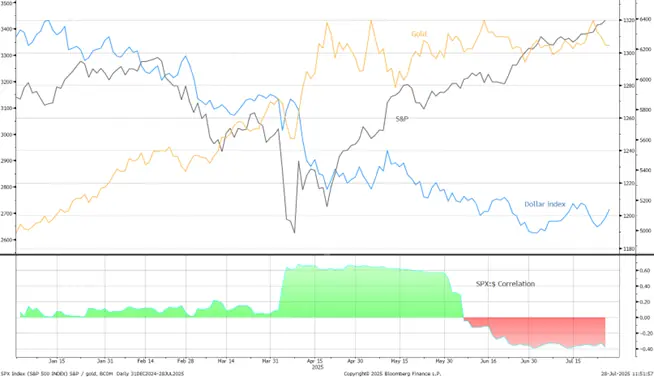
The S&P, gold and the dollar
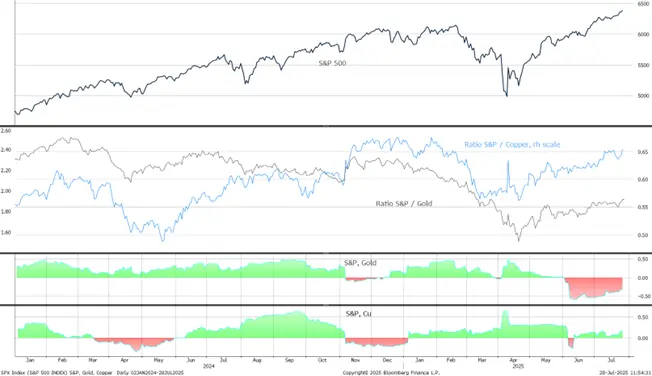
The S&P/Gold and S&P/Cu ratios
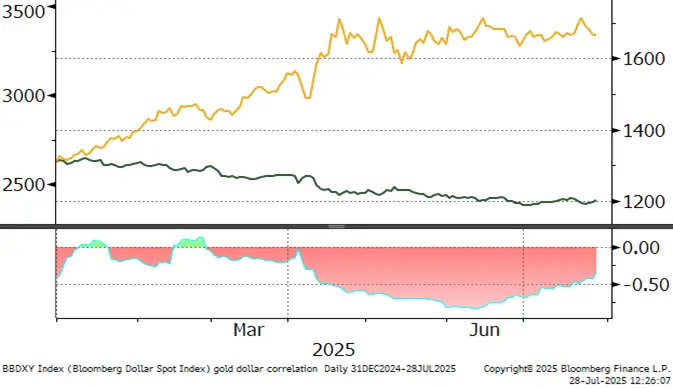
Gold, one-year view; still in a worryingly narrow band
Gold:dollar correlation; contracting again; now at -0.36
Source: Bloomberg, StoneX
Silver, one-year view; resistance at just below $40
Source: Bloomberg, StoneX
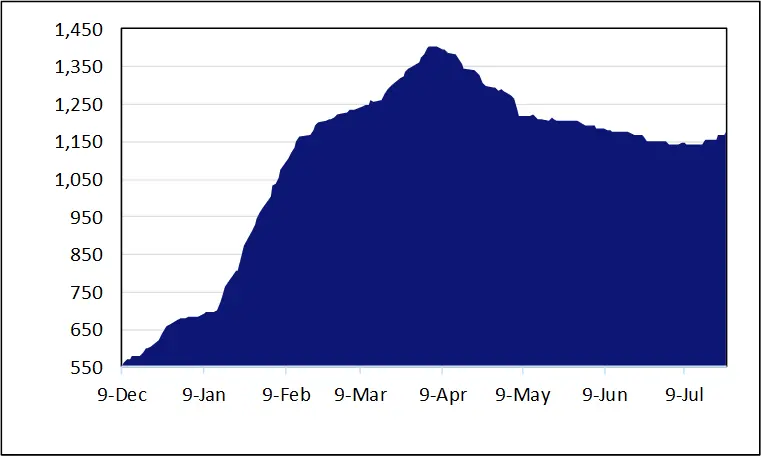
COMEX gold inventories, tonnes
Source CME via Bloomberg, StoneX
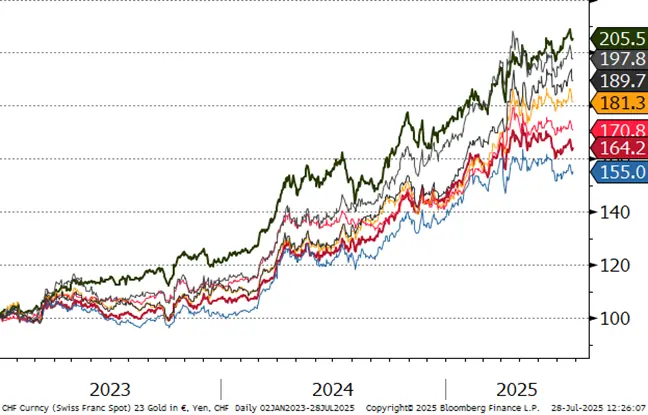
Gold in key local currencies
Source: Bloomberg, StoneX
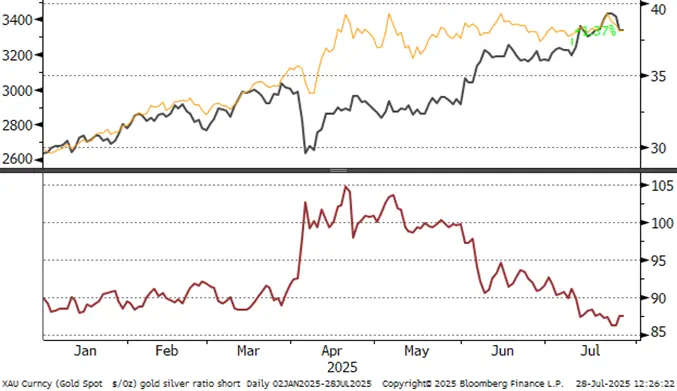
Gold:silver ratio, January 2024 to-date; back to early 2025 levels
Source: Bloomberg, StoneX
Background
The latest CFTC report is that for 22nd July. Since the start of the month the outright gold longs have risen substantially, by 92t or 15% to 605t (just 3% over the twelve-month average) while shorts are up by just 0.3t. Silver longs are up fractionally, by 171.4t or 2% while shorts are up by 307.8t or 12%. Longs are now 25% higher than the twelve month average, at 9,692t.
Gold COMEX positioning, Money Managers (t)
COMEX Managed Money Silver Positioning (t)
Source for both charts: CFTC, StoneX
ETF
Silver: The Bloomberg figures suggest that the net ETF creations in H1 2025 were 1,761t, of which 989t were in June. In other words, 56% of the net gains to that point were in June. Looked at another way, on an unweighted annualised basis, June uptake would be equivalent to 11,864t, or the equivalent of five months’ silver mine production. After some profit taking in mid-July (267t) the buyers have returned and added 636t in five days to a total of 24,558t. World mine production is just less than 26,000t.
Gold: the latest figures from the World Gold Council, up to last Friday, show a slowdown in net creations. This is more a function of reduced buying rather than any heavy sales. In the year to late June net additions were 994t, but in the subsequent four weeks they have dwindled to just 24 to a total of 3,639t. Split: North America, 1,872t; Europe, 1,379t; Asia. 317t after some sales last week; and other, 71t. The year-to-date gains are 13.4%, 7.1%. 46.6% and 10.5% respectively. World gold mine production is 3,661t (Metals Focus figures).

Source: Bloomberg, StoneX