Apr 2025
Apr 2025
Gold Hits $3,500, Silver Eyes Breakout
By Rhona O'Connell, Head of Market Analysis
New gold high made in real terms; maintaining the view that this could be the peak. Uncertainty premium unwinding
- Gold’s intraday print of $3,500.10 on 22nd April took out the old record intraday high (in today’s dollar terms) of $3,486. This was a nominal $850 on 21st January 1980 amidst the second oil crisis, the Afghanistan and Iranian crises and the failed attempt of the Hunt Brothers to corner silver
- This high was in massively overbought territory and the ensuing correction has been extended by some easing in trade and potentially also Ukraine tension
- The risk premium is now being unwound and unless tensions build again, we will stand by our view that we have seen the top
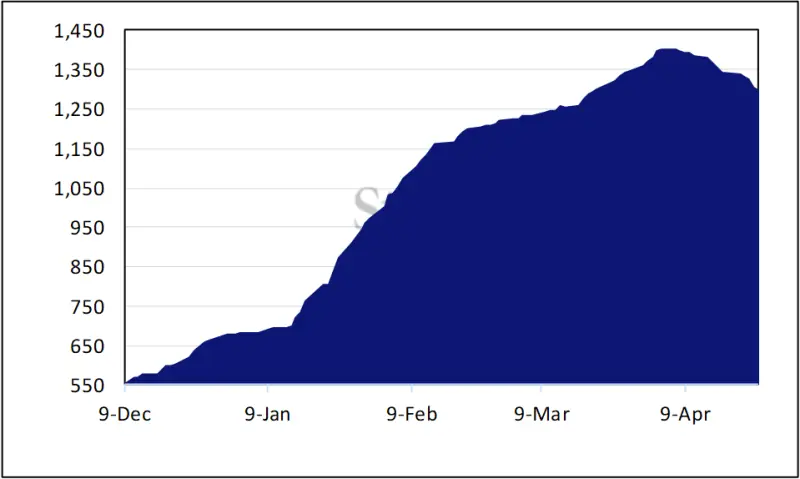
- Gold inventories on COMEX peaked at 1,402t on April 4th. Since then they have dropped by 105t to 1,297t
- With open interest declining the inventory/OI cover is still 94%
- Silver was left behind for a good while, but the latest background developments in tariff terms, at least, are good for silver and less so for gold
- Silver inventories have continued to arrive, but this may well be because the transportation time can be lengthy; the pace is clearly slowing, however, and there has in fact been a small dip recently; at 15,486t last Friday they were up 37t on the week (equivalent to just over six months’ global fabrication demand), or 65% of open interest.
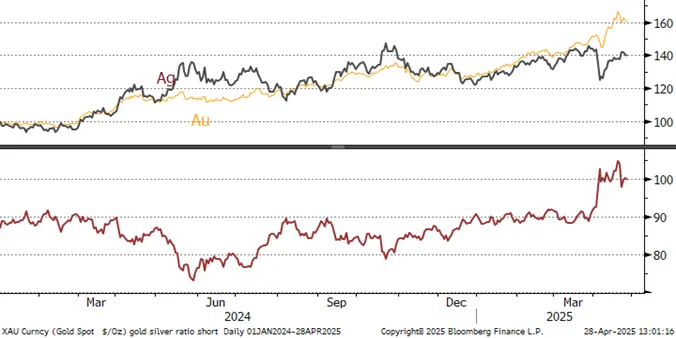
- The gold:silver ratio hit 106 on 4th April but has contracted, partly on initial profit taking, but latterly on the possible improvement in trade terms and a flicker of improved confidence
- Gold ETFs experienced profit taking over the past week, losing a net 11t to 3,534t. World mine production is ~3,600t.
- Silver ETFs also went into reverse at the end of last week, dropping 152t in the final two days, but adding a net 281t over the month so far, for a net gain of 621t year-to-date.
- Shorter term outlook is unchanged: gold is sustaining a correction, but remains well underpinned. We continue to believe that the market is crowded and may yet be due for a further correction but expect prices to remain well-supported while the markets contend with continued uncertainty. If trade and geopolitical tensions ease then we may well have already seen the high for the year, but those pre-conditions are not yet a certainty.
- The gold:silver ratio is likely to remain broadly steady.
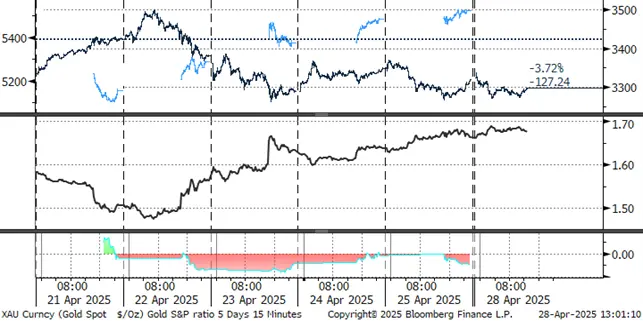
The S&P/Gold ratio continues to recover as risk appetite increases, but cautiously
Source: Bloomberg
Gold in London vaults now amounts to 8,488t (although some of this will be ETF metal), while silver has now posted five months of losses amounting to 4,500t, standing at 22,127t at end-March.

Comment: -
The 90-day reprieve on some tariffs, and the news over the past week-end that the Chinese Government is believed to be considering lifting tariffs on selected US imports, plus the fact that the US has now excluded Chinese electronics from its 145% tariff rate, have given a slight boost to battered confidence and some local analysts are suggesting that this may mean that the worst of the impasse is over – but that any path towards resolution will be a long and rocky one. This is the essence of the moves in the gold market and the converse moves in the industrial metals; a correction but some support in the former, and a recovery, but a tentative one, in the latter.
There is perhaps some further cause for hope in that other countries are moving to fill gaps in China’s imports caused by the loss of US trade; a good example being the Brazilians’ swift action in upping their exports of soybeans, while the Deputy Director of China’s National Development and Reform Commission is reported in the Press as saying that American grains can easily be substituted from alternative sources and that the lack of supply for US grains and oilseeds will have little impact on China’s overall supply.
This may yet be a key in the evolution of the position as the US Farmers’ lobby is a strong one and is also believed to be one of the spines of President Trump’s local support.
There is clearly a long way to go and this will keep gold underpinned but the tariff premium is being unwound. Price action in the metals markets overall remain tightly bound up with geopolitical risk.
COMEX gold inventories, tonnes
Source CME via Bloomberg, StoneX
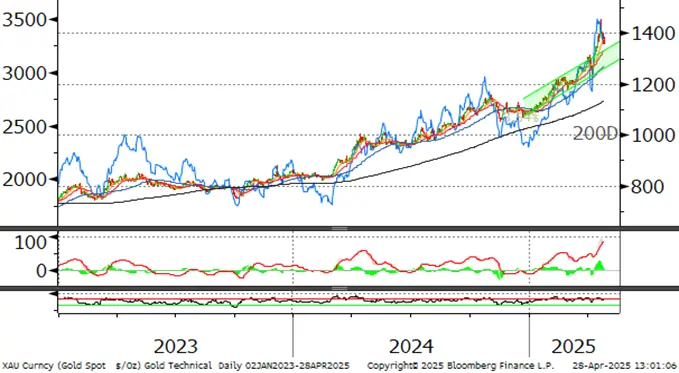
Gold, one-year view; back towards neutral territory
Source: Bloomberg, StoneX
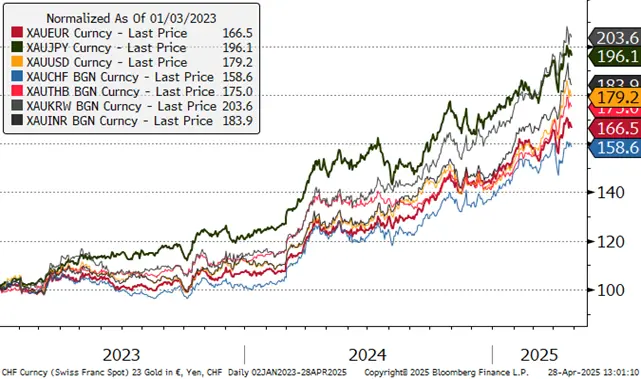
Gold in key local currencies
Source: Bloomberg, StoneX
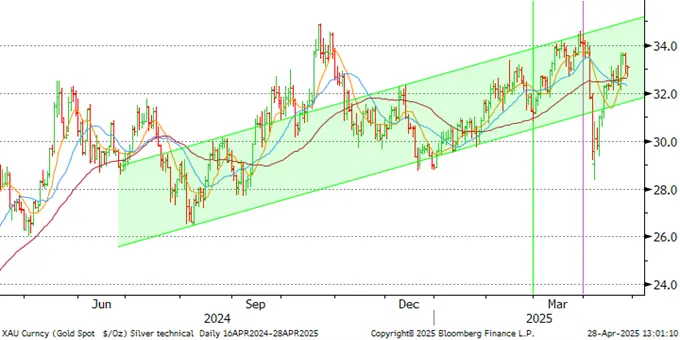
Silver, January 2024 to date; stabilising (insofar as silver can ever be stable!)
Source: Bloomberg, StoneX
Gold:silver ratio, January 2024 to-date; back to100
Source: Bloomberg, StoneX
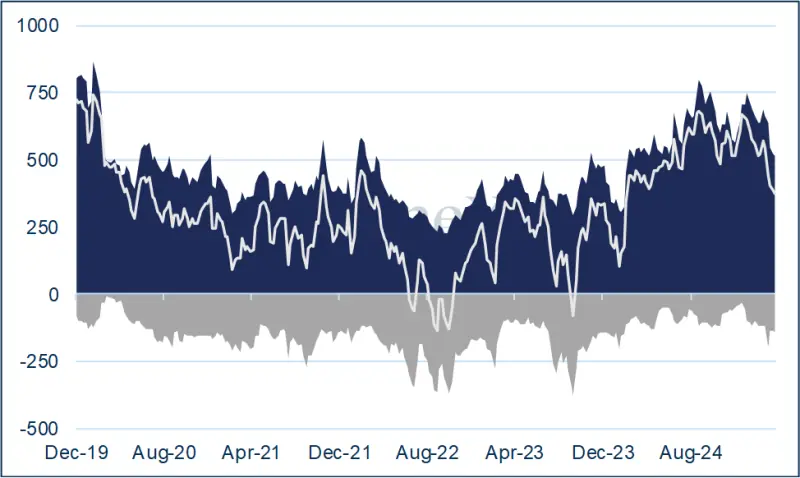
CFTC: from 8th to 22nd April, gold rose steadily to post its new record intraday high of $2,500.10 on the morning of the 22nd, a gain of 15%. It then started its correction, closing the day at $3,381. Managed Money longs reduced their positions over the period, with the outright long contracting from 546t to 517t. Shorts fluctuate, initially contracting very slightly and then expanding for an overall very small gain of just three tonnes to 141t. The outright long on 22nd April was below the twelve-month average by 10%.
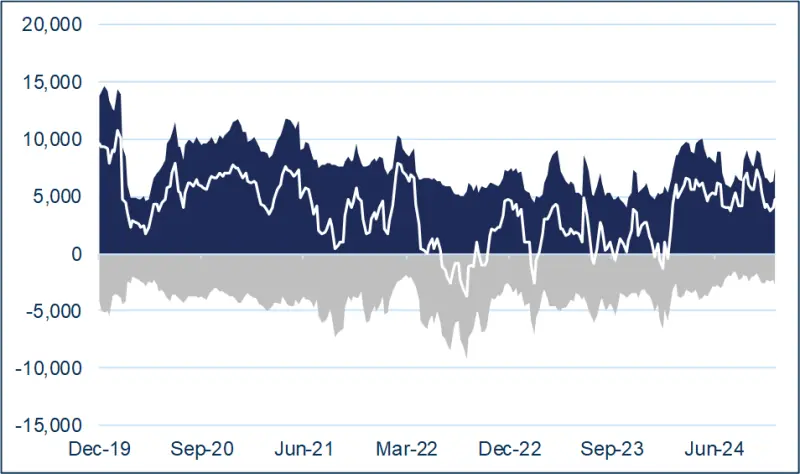
Over the same period silver followed gold’s pattern, posting a fortnightly gain of 10% to an intraday high of $32.5 (it went higher on the 23rd before reversing). The fact that the move, far from being twice that of gold as is more normal in the short term, was actually smaller than gold’s change, reflects silver’s caution about the industrial outlook (and a short-term oversupply in solar cells). The change in positioning saw outright longs drop by a further 9% or 287t while shorts expanded by 14% or 506t to 4,470t. Outright longs were at just 75% of their twelve-month average.
Gold COMEX positioning, Money Managers (t) –
COMEX Managed Money Silver Positioning (t)
Source for both charts: CFTC, StoneX

Source: Bloomberg, StoneX
Repeat from our last note: -
So, what is the Fed doing and how does it work?
Quantitative tightening: not rolling over Treasuries as they mature. Buying bonds from the open market. Both of these actions would alleviate some upward pressure on bond yields.
The standing repo facility (SRF): this was implemented in July 2021. This is designed to keep monetary policy running smoothly, by limiting any overnight upward pressure on interest rates; the use of the SRF means that the Fed makes funds available to primary dealers, and some banks also, by accepting short-term high-quality US Treasuries, agency mortgage-backed securities and agency debt. The SRF can be used proactively, taking potential heat out of the markets, and is used only intermittently, in periods of financial stress.
The reverse repo rate is used to keep the fed funds target rate in the band specified by the Fed. In a repo, the Fed’s open Market Trading Desk (“The Desk”) buys securities from a counterparty with an agreement to resell at a later date. In a reverse repo the Desk sells securities to a counterparty with an agreement to repurchase at a later date. A reverse repo thus reduces the supply of reserves in the system.
And what is the EFP and how does it work?
How does it work? Trading the EFP is a way of hedging market exposure. By buying the EFP, a holder of physical metal contracts with a counterparty to sell the physical position while simultaneously buying the futures. That way the exposure in the metal itself is unchanged, but the delivery date shifts. Some market stakeholders had been using the EFP to deliver metal into the United States ahead of 2nd April to reduce the risk attached to long positions in case of tariff imposition. We were correct in our view that we would not see tariffs on either metal, but it is understandable that some traders – or their risk officers (as was the case during the pandemic) wanted to eliminate any possibility of being caught up in any fall-out.