Mar 2025
Mar 2025
Gold Hits Record $3,057 Amid Global Uncertainty
By Rhona O'Connell, Head of Market Analysis
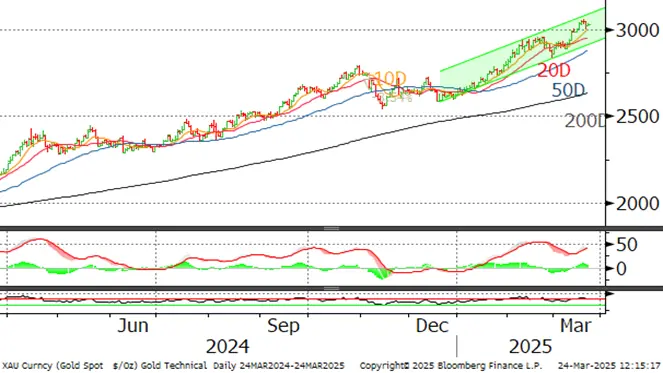
- In the middle of March gold cleared the $3,000 level, drumming up much press coverage in the process
- The driving forces are broadly unchanged in terms of geopolitics and the uncertain economic prognosis, now extending to the United States
- The intraday high thus far was $3,057 on 20th March; the subsequent small correction is finding support from the 10D moving average
- “Tariff Day” is next Wednesday 2nd April, when things should be clearer – but by how much?
- This may take some of the heat out of gold
- While potentially helping silver (and the PGM)
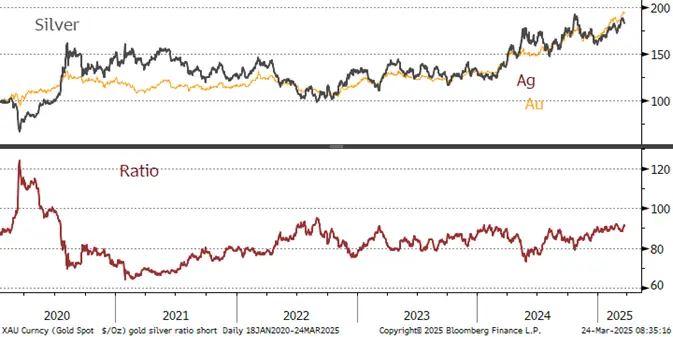
- Silver has continued to underperform gold, underlining its predominantly industrial nature
- Asian gold demand has tailed off, North American coin and bar has fallen away again, but European interest is solid
- The Fed decision last week was expected in terms of rates, but there was a mildly hawkish undertone
Shorter term outlook; both metals likely to mark time ahead of next Wednesday. Expect a knee-jerk reaction to whatever is announced. For the longer-term gold still has strong tailwinds, but whether there is much more upside is questionable. Silver’s long-term fundamentals remain constructive but the President’s aversion to green energy is a stumbling block of sort.
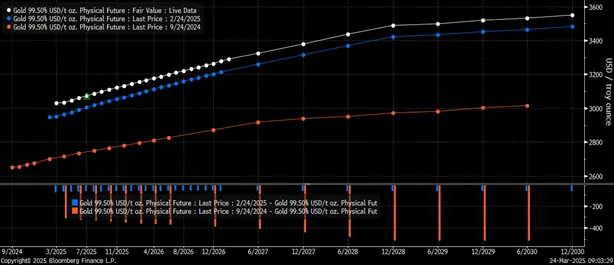
The gold forward curve; now, one month and six months ago; still showing some nearby tightness
Source: Bloomberg
Background activity
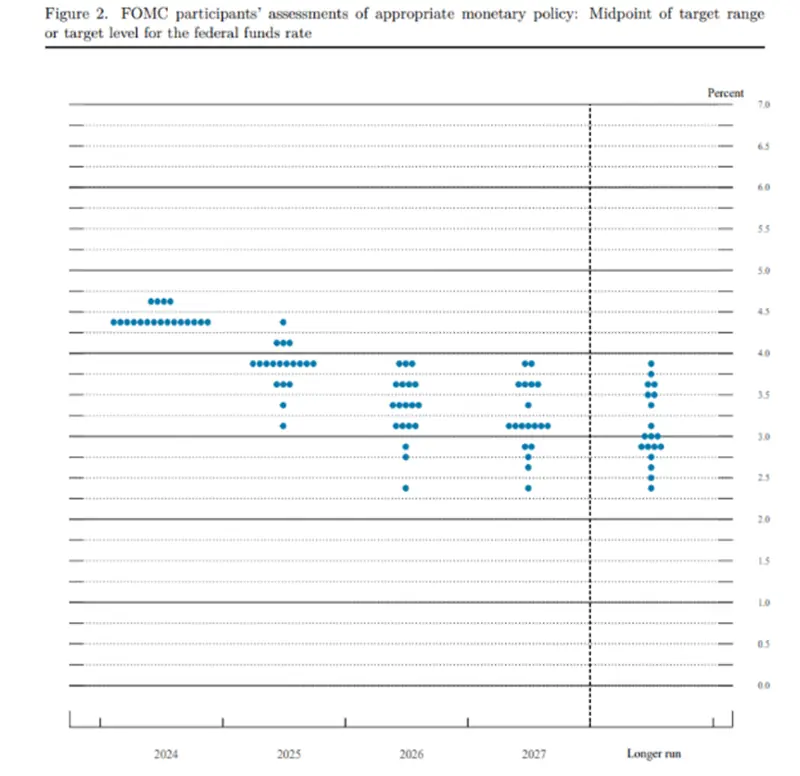
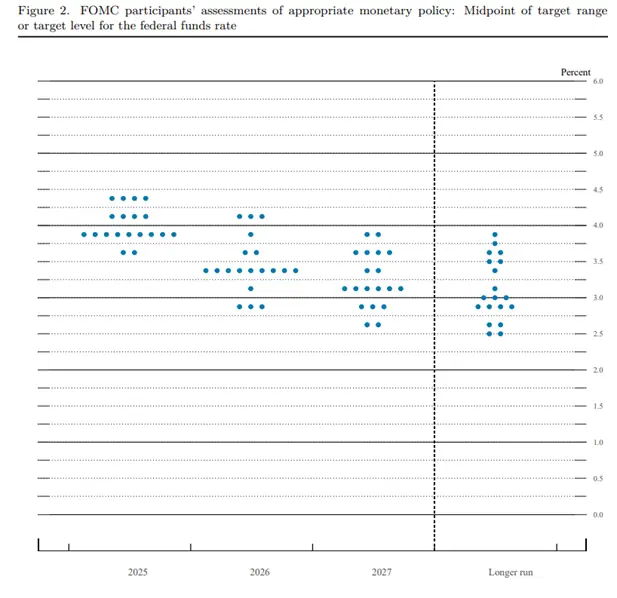
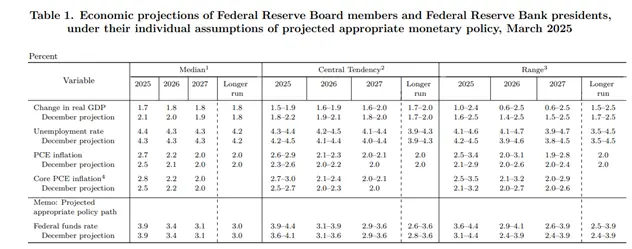
The Fed’s median fed funds target rate projection was left unchanged at last week’s meeting, at two cuts this year, but there is a slightly more hawkish tone with the number of “no cuts” rising from one member to four. Also “3 cuts +” has come down from five participants to just two. Growth projections were reduced, with GDP median for 2025 now at 1.7% and “a bit below 2% over the next two years”. The median in December 2024 was 2.1%. See the table and dot plots below.
The US labour market is broadly in balance with wages rising faster than inflation. Unemployment is currently at 4.1%; projected for end-year at 4.3%.
The median projection for core PCE inflation is 2.7% this year and 2.2% next year. In December this was 2.5% and 2.1% respectively.
The Fed is in no hurry to adjust the policy stance with respect to interest rates and is awaiting further clarity.
As of April, however, the Fed will reduce its rate of Quantitative Tightening, which means slowing the reduction in the balance sheet and which is the Velvet Glove approach to letting market rates ease.
Dot plot December 2024
Dot plot March 2025
Source: Federal Reserve
Note that the dot plots reflect FOMC members’ expectations, not policy.
Demand in the physical markets has fallen away in the Middle East and Asia as a result of the speed of the move, and some scrap return is appearing, while in America some coins have returned to a discount to spot, which is reportedly leading some dealers to sell coins back to the refiners.
Meanwhile the refiners in Switzerland are still working around the clock to deal with the London Good Delivery Bars, which are 400 ounces (12.5kg) with some tolerance on either side and which, to be good delivery into COMEX, need to be either 100 ounces or a kilo. There are already calls in the market for the two centres to be made fungible, something that was addressed during the panic shipments into New York during the pandemic, but which was not sustained. In normal circumstances, fewer than 5% of open interest short positions are settled with physical delivery, but risk managers are still not taking any chances. Comex requires its gold inventories to be in vaults no further than 150 miles from New York City. All four precious metals have seen shipments into New York in pre-emptive action against possible tariffs – although tariffs on gold are extremely unlikely as it is a reserve asset.
Here is the latest summary of movements (10th
December is when material started coming into New York as risk managers had started worrying about the tariff threat).

Gold, one-year view; now in a steeper channel
Source: Bloomberg, StoneX
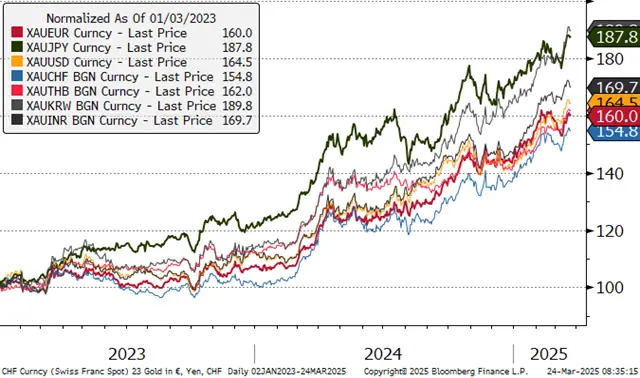
Gold in key local currencies
Source: Bloomberg, StoneX
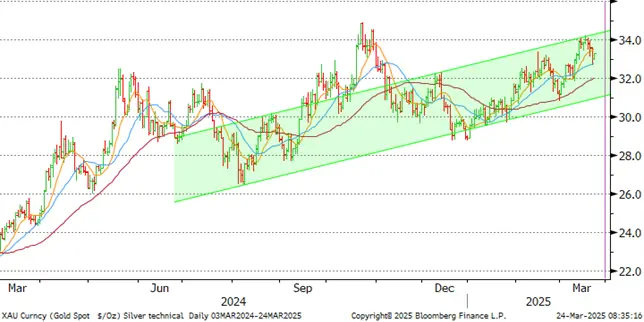
Silver, one year view; failed at $34 and has completed a Fibonacci 38% retracement
Source: Bloomberg, StoneX
Gold:silver ratio, January 2024 to-date; Europe, China weighing on silver
Source: Bloomberg, StoneX
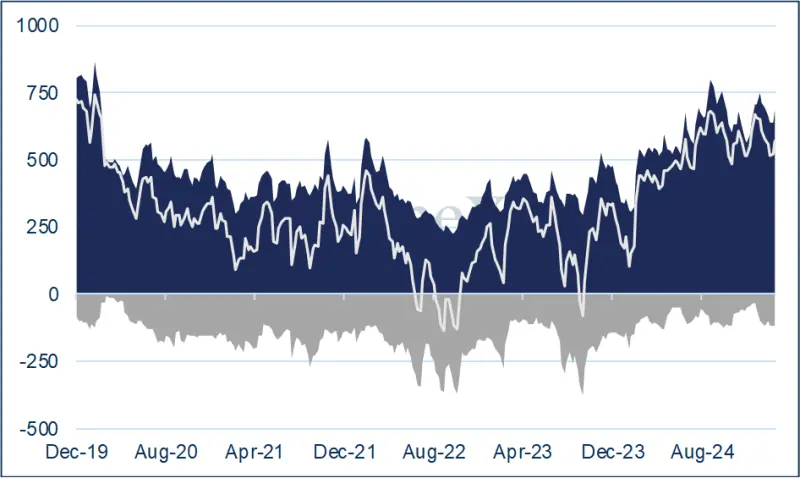
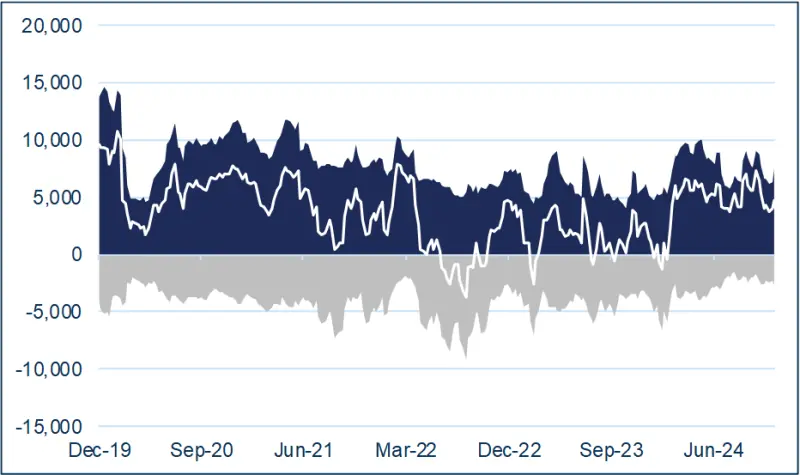
CFTC; gold sentiment has turned more bullish; silver expands on both sides
Gold longs contracted from early February through to 11th March, dropping from 748t to 637t. In the week to 18thMarch, when gold rose from $2,880 to $3,018 (4.8%) longs added almost 50t or 7.8%, no doubt fuelled in part by the psychological impact of the $3,000 level – sentiment that has also permeated the OTC market. Shorts added just one tonne.
Silver’s outright longs also burst higher, rising from 8,800t to 10,086t in one week, or 14.6%. Shorts also added length, but only 66t or 3.8% as the silver price rose from $31.8 to $34.2 (11%), where it peaked, right on the upper band of its trend channel – now trading at $33.
Gold COMEX positioning, Money Managers (t)
COMEX Managed Money Silver Positioning (t)
Source for both charts: CFTC, StoneX
So what is the EFP and how does it work?
How does it work? Trading the EFP is a way of hedging market exposure. By buying the EFP, a holder of physical metal contracts with a counterparty to sell the physical position while simultaneously buying the futures. That way the exposure in the metal itself is unchanged, but the delivery date shifts. Some market stakeholders have been using the EFP in order to deliver metal into the United States ahead of 20th January in order to reduce the risk attached to long positions in case of tariff imposition. In our view tariffs on either metal, especially gold, are unlikely, but it is understandable that some traders – or their risk officers (as was the case during the pandemic) want to eliminate any possibility of being caught up in any fall-out.
ETFs:
Global ETF gold holdings
Gold ETFs were revitalised during February, with North America turning from net selling in December and January to a net purchase of 72t in February for a net investment of $6.8Bn. The global flows have continued into the first three weeks of March with more than 50t of net purchases. The latest figures from the World Gold Council record an increase of 41t in the first half of the month and at least another ten tonnes have gone in since then.
In the year to mid-March, the flows were as follows:

Source: World Gold Council
Note the continued inflows into Asia. The scope for large increases in the region is potentially huge.
Silver is still seeing sporadic light sales but also some chunky net positive days. In March to date, Bloomberg records a net increase of 163t; year-to-date, till in the red, with a small reduction of 65t to 22,211t.
Global mine production is ~26,000t.

Source: Bloomberg, StoneX