Jul 2024
Jul 2024
Gold's Intraday Highs and Market Movements: An In-Depth Analysis
By Rhona O'Connell, Head of Market Analysis
- New intraday record highs for gold last week but net unchanged over the period
- Gold’s rally from the start of the week to the peak of $2,483 was 3.1%
- Massive jump in gold outright Managed Money longs in the week to 16th July. Very toppy
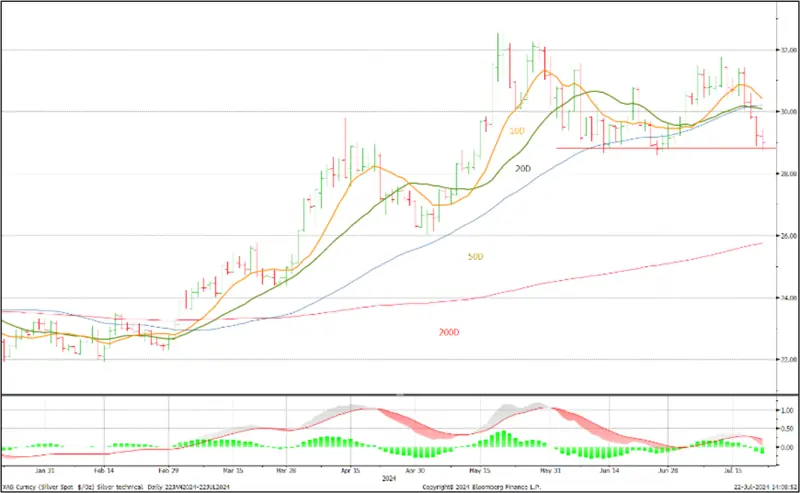
- While silver’s move was insipid and followed by a slide of over 8% to three-week lows
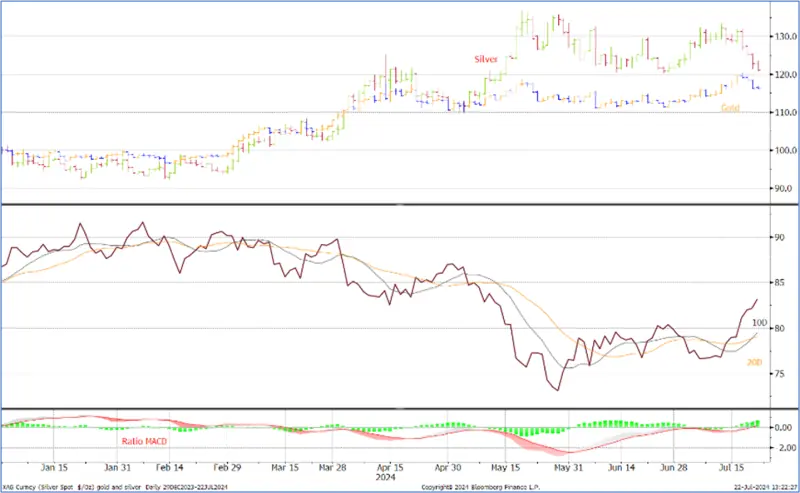
- As last week, part of this may be technical as the ratio’s moving averages have turned bullish
- President Biden’s decision to relinquish candidacy is neutral, at least for now
- Gold ETFs added plenty of metal last week; silver more or less neutral
- Jay Powell appears to be readying the markets for a September cut
Outlook; the overall outlook for gold remains positive on the back of geopolitics and economic uncertainty. The US’ political developments over the weekend are neutral for now, at least, especially as Kamala Harris is not yet confirmed as the Candidate and there is obviously a period of uncertainty ahead.
Gold, silver and the ratio, year-to-date; bullish ratio technicals
Source: Bloomberg, StoneX
Gold’s rally to new highs came on the back of continued professional buying interest while the physical market had slowed down; this is normal when a new price range is establishing itself and those markets will build again as would-be purchasers get used to the new levels. Ultimately momentum did run out as the price made new highs, but what was interesting was that the rally came as US economic numbers were stronger than expected and therefore might, in earlier times, have put pressure on the gold price.
This can almost certainly be put down to the fact that the markets are increasingly expecting a rate cut in September, while in the background the fact that Mr. Trump was gaining more ground in the Presidential race would have helped as his vigorous geopolitical attitudes and his pro-industry stance, plus his approach to international trade and tariff imposition are all elements that would support gold.
Now we move into what could be an extended period of limbo as the Democrats wade through the period of transition. The Democratic Party’s convention takes place in Chicago from 19th-22nd August. Kamala Harris has the alliance of a number of powerful Democrats, including a few that might have been considered contenders, but at the time of writing she notably lacks endorsement from the Obamas, with Barack talking of an open process, and Nancy Pelosi has been silent so far. The Chair of the Party said overnight that “the work that we must do now, while unprecedented, is clear. In the coming days, the Party will undertake a transparent and orderly process to move forward as a united Democratic Party with a candidate who can defeat Donald Trump in November….This process will be governed by established rules and procedures of the Party. Our delegates are prepared to take seriously their responsibility in swiftly delivering a candidate to the American people."
I have put together some initial thoughts, the markets’ reaction and a biography of Harris , which can be found here.
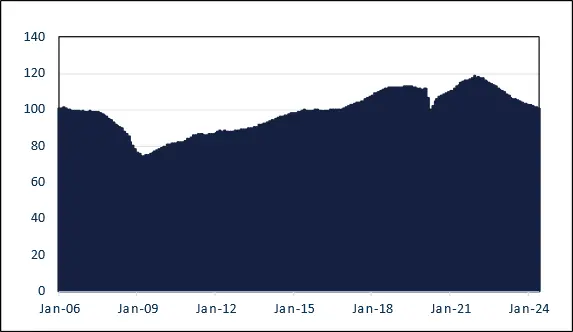
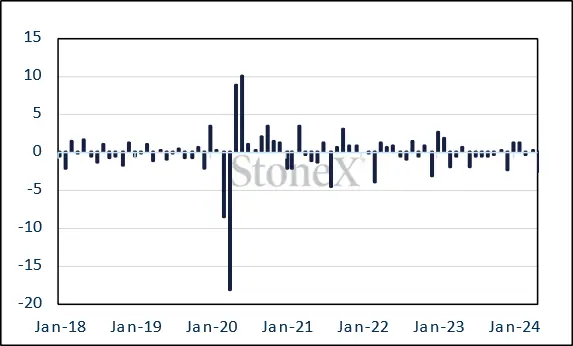
Silver’s dismal performance last week continues to reflect the uncertainty over the economic outlook in the major regions, especially a ZEW Survey (EU economy), for which the June reading was 41.8, compared with 51.3 the previous month. This was the first fall in a year, although the assessment of the situation in Germany improved slightly. There has been aggressive selling in the markets and unwanted material (dealers have high inventories) is still finding its way back to the refineries. The Swiss trade figures for Germany, for example, show net imports of 36t over the past four months (i.e. 9tpm on average). This may not seem like much in a 38,000t+ market, but it compares with net monthly imports of 11tpm over 2023.
US Leading Economic Indicators
Source: Bloomberg, StoneX
Germany Industrial Production Y/Y
Source: Bloomberg, StoneX;
In addition, we mentioned last week that the gold:silver ratio’s technical indicators were becoming bullish; the 10-day moving average has now moved above the 20-day, which may continue to bode ill for silver.
Silver, year-to-date; technical indicators
Source: Bloomberg, StoneX
Meanwhile, the gold ETFs added 20t over the past six days, all of which were net creation days, and the net change over the month to date is 33t, while silver has lost 24t so far this month. The past three days have seen some bargain hunting so it is possible that we may have turned the corner, but – rather like the Fed – we need more data!
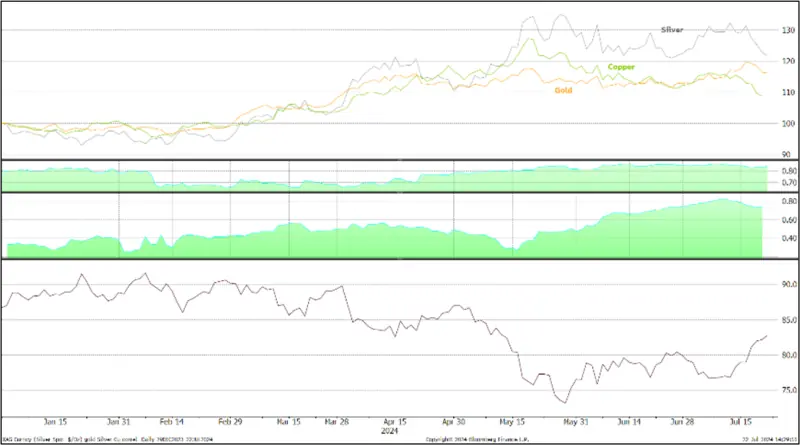
Gold, silver and copper: silver correlation with gold, 0.84; with copper, 0.74
– looser with copper this time and steady with gold
Source: Bloomberg, StoneX
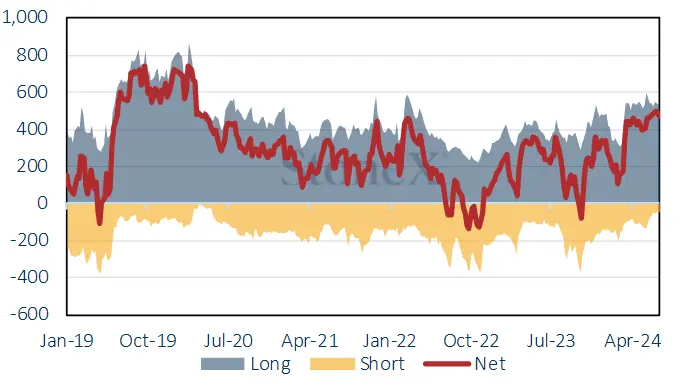
On COMEX there was a large increase in outright Managed Money longs in the week to Tuesday 16th July (spot rising from $2,358 to $2,423 over the period) with a jump of 107.4t (19%) to 673.4t, the highest since March 2020 and a massive 58% over the preceding twelve-months’ average. Shorts expanded by 23t to 99t so the net long blew out to 574t from 490t.
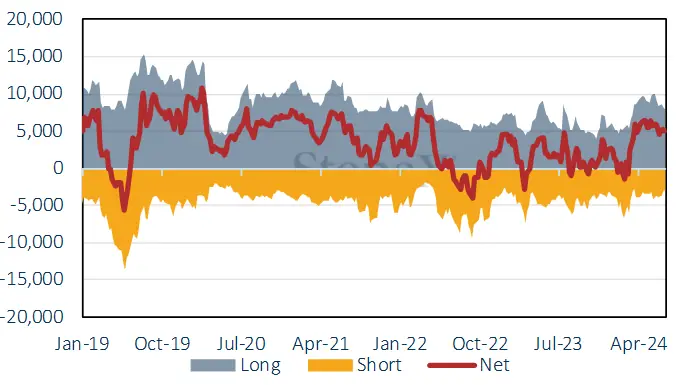
Silver (spot moved from $31.15 to $31.24 over the week) had the opposite fortunes, with longs only increasing by 1.2% or 110.3t and shorts rising by 297.5t (11.%) to take the net long to 5,996t.
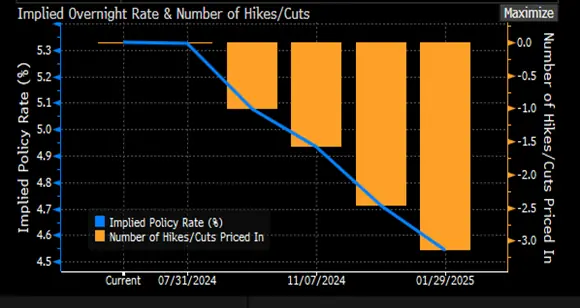
Bond markets’ expectations for the rate cycle; now looking at a 98% chance of a September cut and 88% of one in December
Source: Bloomberg
COMEX
Gold COMEX positioning, Money Managers (t)
Source: CFTC, StoneX
COMEX Managed Money Silver Positioning (t)
Source: CFTC, StoneX

Source: Bloomberg, StoneX