Jul 2024
Jul 2024
Gold above $2,400: Market trends, interest rate cuts and global economic influences
By Rhona O'Connell, Head of Market Analysis
- The psychological $2,400 level has been cleared again
- Inflationary forces abating but likely still too high for the Fed
- As usual, silver posted the larger gains…
- …but has retreated since, while gold is steady
- Part of this may be technical as the ratio’s moving averages have turned bullish
- And another part is likely to be European and Chinese economic underperformance
- Gold ETFs still adding metal, silver mixed
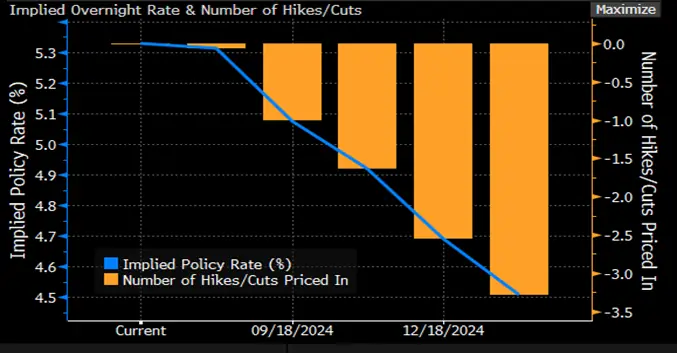
- US bond markets now looking at a 95% chance of a September cut and 88% of another in December
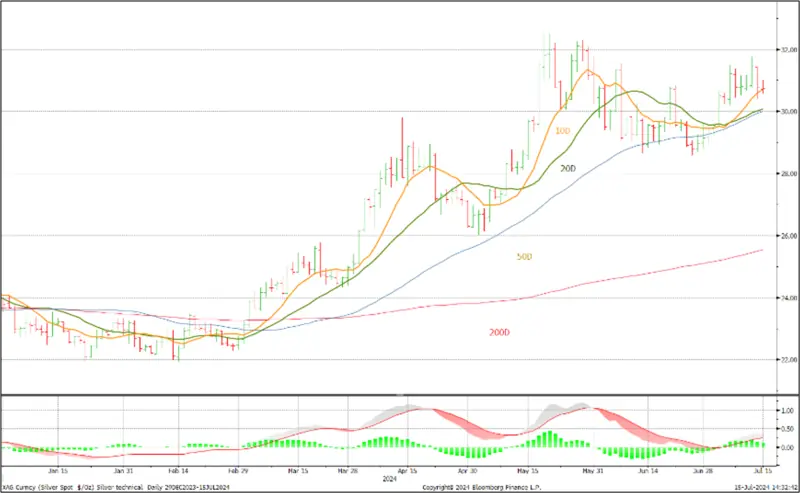
Outlook; the overall outlook for gold remains positive on the back of geopolitics and economic uncertainty. Gold’s change of range is small and shouldn’t deter would-be buyers. Silver has corrected from overbought conditions, but the long-term outlook remains favourable from automotive, solar and electrical considerations.
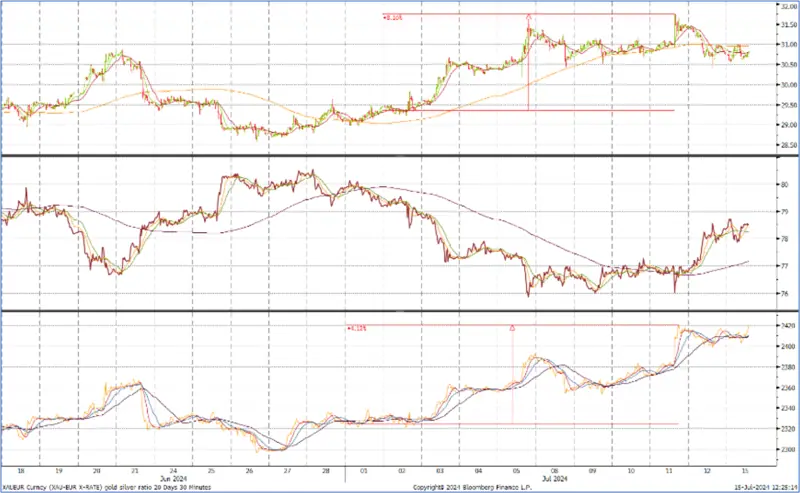
Gold, silver and the ratio, January 2023-to-date
Source: Bloomberg, StoneX
In many ways gold and silver’s performance last week were similar to that of the previous week, but in a slightly higher range. Following Jay Powell’s comments that good progress was being made to contain inflation, the benign NonFarm Payroll figure boosted gold towards $2,390 but this was relatively short-lived, with those gains wiped out last Monday, taking gold back to $2,360. Technical indicators were becoming more bullish, however, and after some profit taking on COMEX, prices stabilised as investors looked forwards and found themselves faced with continued geopolitical uncertainty and a degree of economic turmoil.
This of course has now been exacerbated by the attack on former President Trump in Pennsylvania. Ordinarily when the dollar strength and yield curves steepen one might expect gold to lose some of its attraction, but this development – while likely strengthening Mr Trump’s position in the Presidential race, which is theoretically good for US growth and by association, equities, is different as it wreaks a degree of havoc into the campaigns on both sides and it is not unusual for the dollar, yields and gold to rally when the markets are in risk-off mode.
Gold , accordingly, is holding its gains.
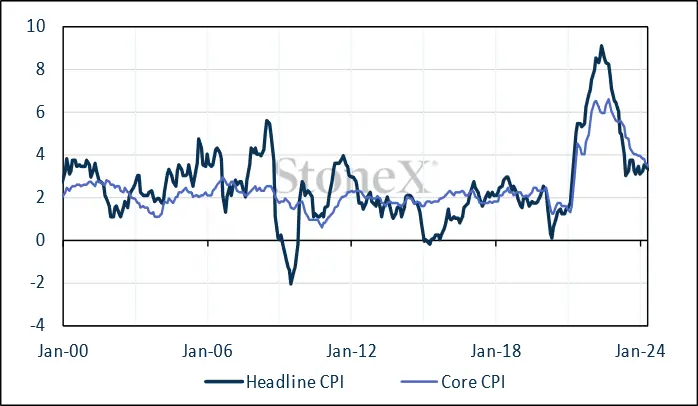
The inflation figures released last week were mixed but taken well, on the whole. The Producer Price Indices were released on Friday and the Final Demand numbers were negative month-on-month and just +1.1% year-on-year. In other areas, though, the results were higher than expected, with core PPI (excluding food and energy) off 0.4% M/M and 3.0% Y/Y. It is possible, therefore, that these pressures will find their way into next month’s CPI numbers.
This month’s numbers, though, were softer than expected, with headline CPI at minus 0.1% M/M and 3.0% Y/Y. This is still higher than the Fed would want so we can rule out a July cut (the next FOMC meeting is 30th and 31st).
Meanwhile the next guidance as to the Fed’s plans will come from the Beige Book, which is published this Wednesday 17th. In the words of the Fed, “Each Federal Reserve Bank gathers information on current economic conditions in its District through reports from Bank and Branch directors, plus interviews and online questionnaires completed by businesses, community organizations, economists, market experts, and other sources. Contacts are not selected at random; rather, Banks strive to curate a diverse set of sources that can provide accurate and objective information about a broad range of economic activities. The Beige Book serves as a regular summary of this information for the public.”
More than that, it is a key guide for the FOMC and they pay close attention to it.
Silver, year-to-date; technical indicators
Source: Bloomberg, StoneX
Meanwhile, elsewhere…
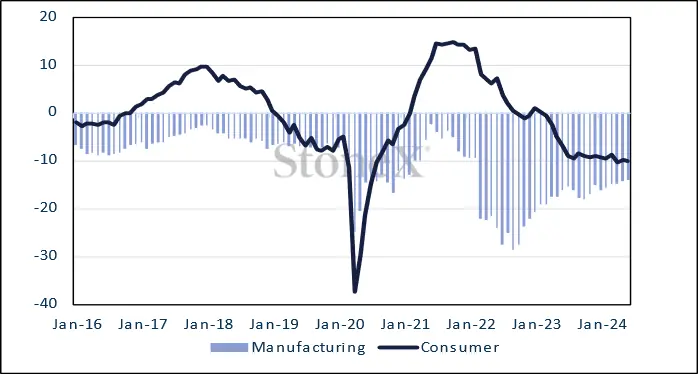
German Industrial Output in June was down 6.7% year-on-year at the lowest level since before the pandemic. We have the Ifo Industrial Confidence indicator released this Tuesday 16th and CPI on Wednesday 17th, followed by Construction Output on Thursday.
US CPI
Source: Bloomberg, StoneX
Germany Business Climate Index
Source: Bloomberg, StoneX
China’s GDP growth fell to 4.7% in Q2 from 5.3% in Q1, and undershooting expectations. Domestic Consumption, which is the main driver, came down, with retail sales dropping to 2.0% from 3.7% in May and well below expectations of 3.3%. Auto sales are still under pressure, falling 6.3%, after a 4.4% decline in May. Fixed asset investment was down and property remained under pressure, with home-selling space down 19.1% after a decline of 20.3% previously.
So these numbers point to buoyancy in gold, while silver, if gold starts to tread water, is likely to underperform in the near term because of its industrial nature.
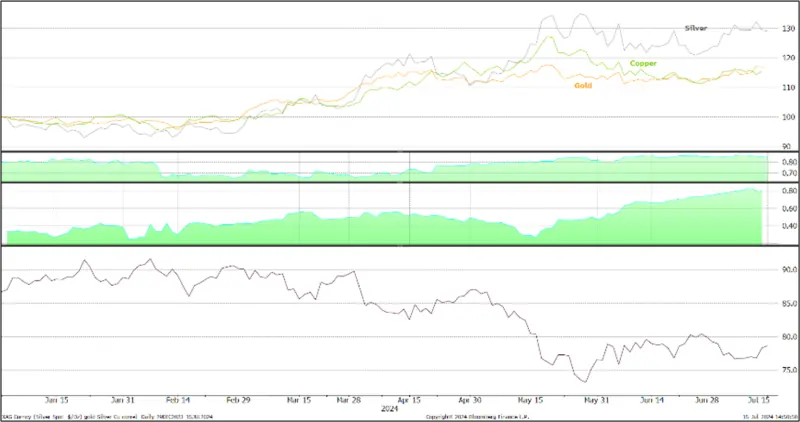
Gold, silver and copper: silver correlation with gold, 0.84; with copper, 0.79
– tighter with copper than last week and looser with gold
Source: Bloomberg, StoneX
Bond markets’ expectations for the rate cycle; now looking at a 95% chance of a September cut and 92% of one in December
Source: Bloomberg
In the background the gold Exchange Traded Products have been increasingly positive. In June (after a net gain of 8.2t in May) the gold ETFs added 7.6t, but in the first ten days in July they have added a net 18.7t for a year-to-date fall of 102t to 3,124t (world mine production is roughly 3,700tpa). In the first half of the year (the latest figures available from the World Gold C council) North American funds lost 78t or 4.7%, Europe dropped by 82.8t (6.0%) and Asia stayed positive, adding 41.3t or 30.1%.
Silver is faring less well. The ETPs added 178t in June in mixed trade with nine days of net creations from a total of twenty; in the first ten days of July they have lost 31t with four consecutive days of reasonably solid selling last week for a year-to-date the loss of 340 to a total of 21,430 (global mine production is ~26,000tpa).
COMEX
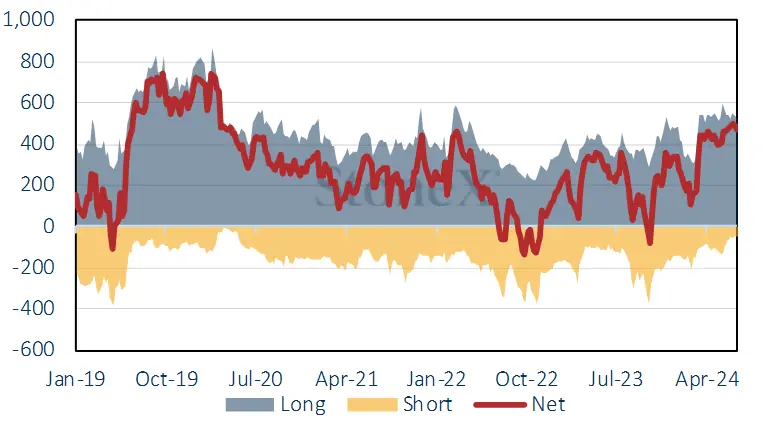
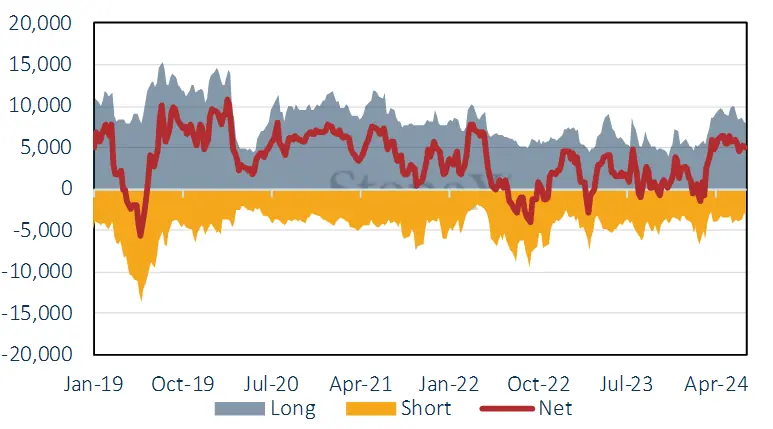
The Commitments of Traders reports show that over the fortnight to July 9th the outright gold long position on COMEX came down by 31t or 5.6% to 522t, while outright shorts dropped by one tonne or 0.9% to 52t or 469t. The outright long stood at 19% over the twelve month average, which is still a little toppy but not extravagantly so. The silver position has cleared out more of its COMEX overhang, shedding 561t over the fortnight, a reduction of 6.6% to 7,969t, while the shorts contracted by 18% or 642t to 2,896t. This leaves the net position at 5,073t.
Gold COMEX positioning, Money Managers (t)
Source: CFTC, StoneX
COMEX Managed Money Silver Positioning (t)
Source: CFTC, StoneX

Source: Bloomberg, StoneX