Aug 2024
Aug 2024
Gold Rebounds Amidst Equity Recovery, Silver Outperforms, and the Yen Carry Trade Explained
By Rhona O'Connell, Head of Market Analysis
- Gold quickly unwinds the majority of its equity-induced losses of last Monday
- While silver loses some of its caution and outperforms gold
- Net gains are only marginal, however
- Equities have regained their poise after the volatility of a week ago
- The yen carry trade explained
- Gold and silver ETFs are mixed, with a couple of chunky net redemptions outweighing cautious buying
- Gold:silver ratio easing slightly, now just below 88
- The gold:S&P ratio has corrected after mild over-extension
- US 10Y yields ended the week unchanged, 2Y down just 0.12%.
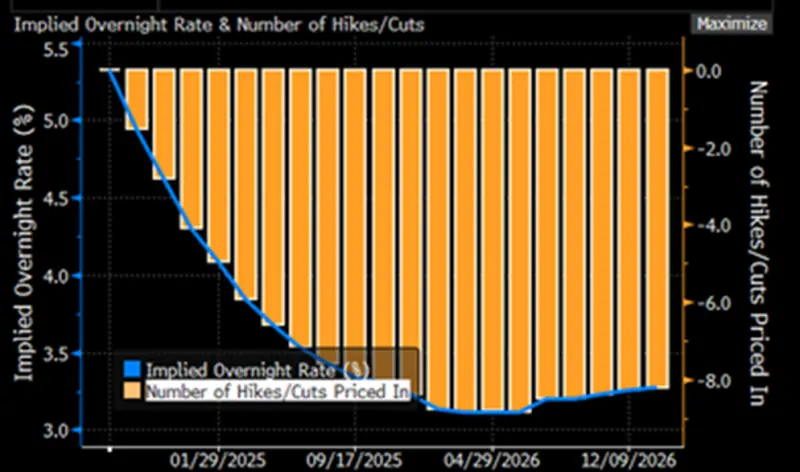
- Swaps markets still pricing in 125 point rate cuts this year and expecting 50 points in September
- US PPI and CPI this week
Outlook; after reasserting its role as a mitigator of risk in the face of equity vulnerability early last week, gold’s new investment constituency is expected to maintain its exposure to the metal and it is possible that more will be enticed in. For now, though, conditions are steady. After US numbers last week that showed more signs of a slowing economy the markets are expecting a 50-point cut on September 18th. If this doesn't happen gold will be likely to dip, but the longer-term outlook remains solid. Silver has started to shake off some of its torpor and may now start to revive, but it will need help from gold.
Last week’s action in the equity markets was a combination of underwhelming US economic numbers and, more importantly, the fall-out from the unwinding of the yen carry trade in response to the Bank of Japan’s rate hike. The Bank subsequently changed its stance slightly (but not the interest rate), with the Deputy Governor saying that further rate hikes would wait for calmer conditions. It has been suggested that a central bank should lead the markets rather than following them and it has to be said that there is merit in this argument.
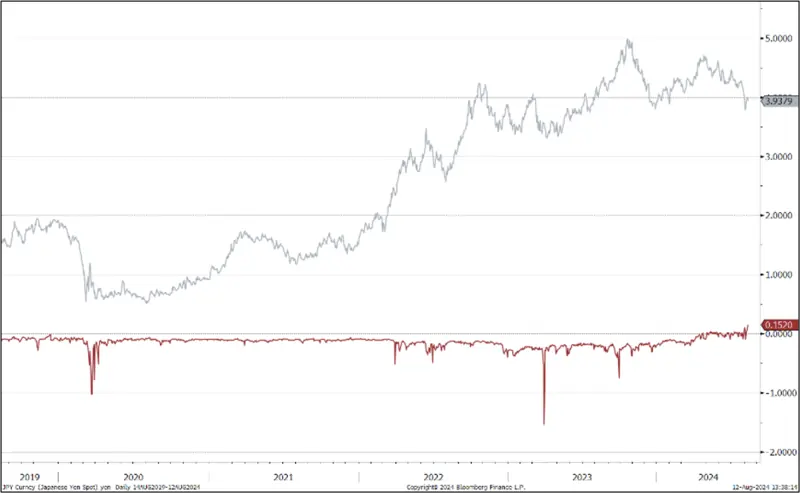
Japan and US 10-year bond yield; five-year view
Source: Bloomberg, StoneX
Meanwhile – a quick explanation of the Yen carry trade.
A technical title for a simple exercise. Japan has historically operated with very low interest rates – sometimes even negative in nominal terms (see above chart) and the yen carry involves borrowing in yen at the associated low rate and investing in high (or higher)-yielding assets and currencies. Simple! It has been extremely popular since the start of this century when the Bank of Japan slashed interest rates after the domestic asset bubble had burst, and has commanded high volumes, from both domestic and international investors. More often than not the trade is a short-term exercise. In October last year the differential with the US 10-year yield was as much as 5.2%, for example.
At first glance an increase in the policy rate target to 0.25% from 0.0-0.10 previously doesn’t seem particularly significant but the impact on market sentiment was very strong because of the signal that the move made with respect to a change in policy and, as with all markets, expectations are a key to performance.
Consequently, unwinding the carry meant that the other assets, bought via the borrowed yen, had to be divested. This was the major driver behind the equity markets’ weakness and also explains the fall in oil prices last week.
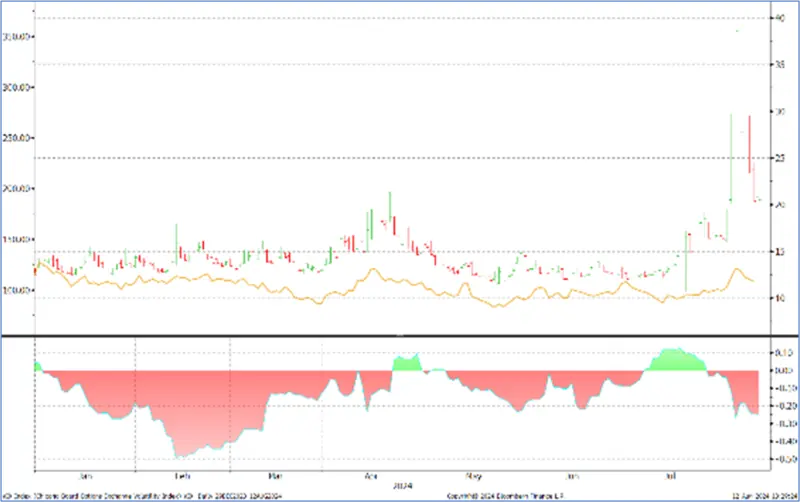
The volatility in the equities and some currencies was relatively short-lived, however and as the chart below right shows, the VIX (equity uncertainty measured through options volatility) and the MOVE (ditto but in the bond market) indices have retraced a lot of their earlier gains – although they are still relatively high.
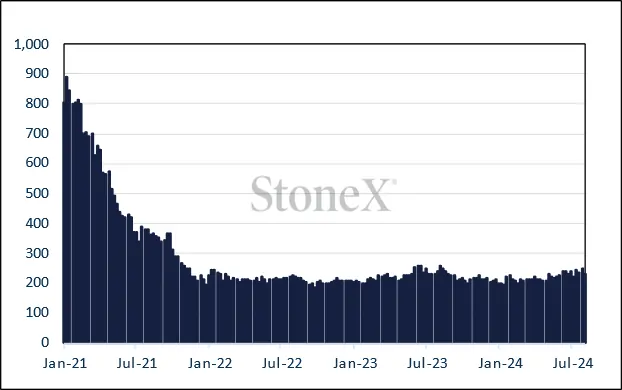
US initial jobless claims
Source: Bloomberg, StoneX
VIX, MOVE
Source: Bloomberg, StoneX
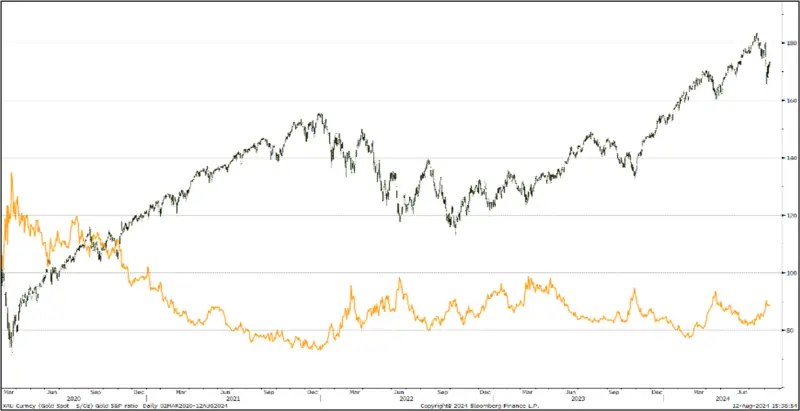
Gold and the S&P from the COVID crash
Source: Bloomberg, StoneX
As we noted last week: “Goldinitially came down with the equity markets before recovering mildly but is still under a degree of pressure. This is not unusual; more often than not when equity markets turn down sharply gold is sold as a hedge against risk, in order to raise liquidity against potential margin calls. Those sellers almost invariably then re-establish their positions when the dust settles. A good case in point is gold’s performance in the meltdown at the onset of COVID; gold fell along with everything else, but unwound its losses in four weeks, while it took the S&P six months to claw its way back”.
That comment still holds good.
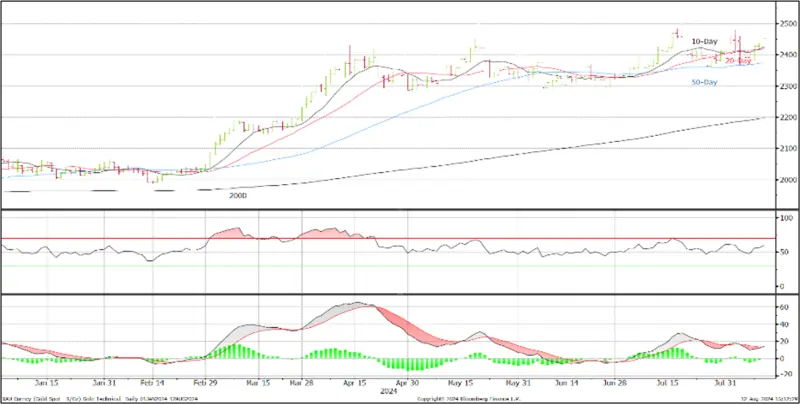
In the market itself, gold is edging higher ahead of the PPI and CPI readings in the States, due on Tuesday and Wednesday of this week respectively. . The PPI and core PPI (excluding food and energy) are called at 0.2% and 0.2% month-on-month respectively and 2.3% and 2.7% Y/Y. The CPI numbers are, on the same basis, called at 0.2% and 0.2% M/M, and 3.0% and 3.2%. Retail sales are also due this week, which will be another key indicator of the evolution of the US economy under the Fed's current restrictive stance. Anything higher than the market expectation could see some reduction in the length in the gold market, but any such move would likely be short-lived.
Gold, year-to-date; technical indicators turning positive
Source: Bloomberg, StoneX
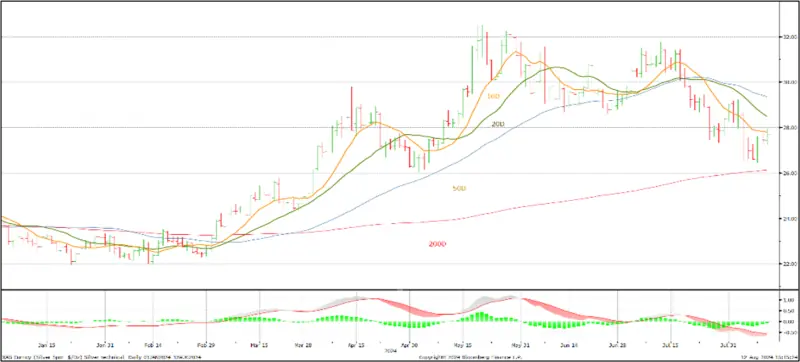
Silver is looking a little livelier and with headlines referring once more to gold’s potential challenge of record high ($2,457), some of that sentiment has spilled over into silver; today, as is normal when silver is paying attention to gold, the intraday moves have been twice those of gold and the $28 level is under threat, although volumes are relatively low. There is upside resistance, however, with the 20-day moving average at $28.46 and the 50-day at $29.34.
Silver, year-to-date; technical indicators
Source: Bloomberg, StoneX
Meanwhile gold ETFs saw some hefty redemptions last Friday after four days of light buying interest, taking the year-to-date losses to 74t for holdings of 3,151t. Global mine production is ~3,750t. Silver ETFs were also mixed with three days of creations but two of moderate redemption, for a weekly loss of 53t, for a year-to-date gain of 516t. Global mine production is ~25,800tpa.
Bond markets’ expectations for the rate cycle; now looking at a 153% chance of a September cut -which means they are discounting 50 points, 125% for November and 127% of one in December, to close the year at 4.31%. This is slightly more restrictive than the equivalent reading last week.
Source: Bloomberg
COMEX
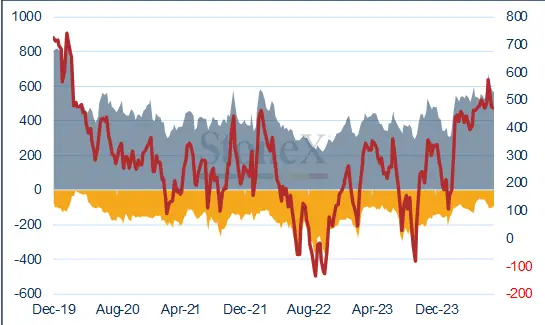
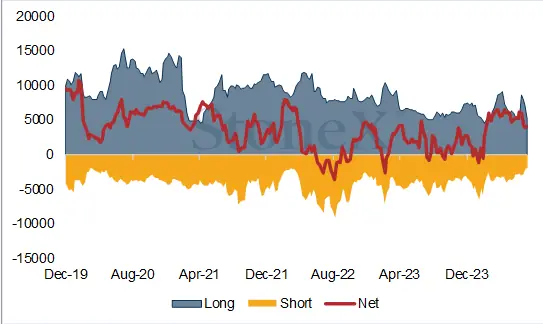
Gold was mildly lower in the week to 30th July, dropping sharply but then recovering to finish 0.7% lower at $2,430 and silver dropping again, losing 2.3% to finish at $28.37. Gold outright longs dropped by 6% or 38t to 577t; outright shorts fell by 5% to 103t. Net long down from 507t to 474t. Silver outright longs fell by 11% to 6,092t and shorts contracted by 25%or 103t to 2,128t. Net long down 4% to 3,964t.
Gold COMEX positioning, Money Managers (t)
Source: CFTC, StoneX
COMEX Managed Money Silver Positioning (t)
Source: CFTC, StoneX

Source: Bloomberg, StoneX