Jun 2024
Jun 2024
Gold's Record High and Silver's Surge: Market Dynamics and COMEX Activity
By Rhona O'Connell, Head of Market Analysis
- Gold posted its all-time nominal intra-day high (but 39% off the peak in real terms) on the day when we last wrote, 20th May
- The outright Managed Money longs on COMEX the following day were at a 219-week high, at 593t
- The subsequent reversal came with heavy liquidation but the position was still eight tonnes higher than a fortnight previously
- Silver has outperformed, taking the gold:silver ratio down to 72.3 last week, although that has rallied slightly since.
- It looks as if there were maybe one or two silver market stakeholders scrambling to cover positions. COMEX longs did not bail out in the week to 28th May, but are likely to have done so to a degree since then
- Price action has affected expenditure on gold Eagles, while silver expenditure has risen
- Very heavy silver turnover on the Shanghai Futures Exchange in May.
Outlook; gold continues to benefit from geopolitical risk with the global elections rumbling on and the official sector continuing to diversify into gold. The “higher for longer” mantra from the Fed may well now be fully baked in. Silver has a strong long-term outlook, but in the short term we could see a further downward correction as a double top has been completed, suggesting a further retreat towards $27.5-28.0
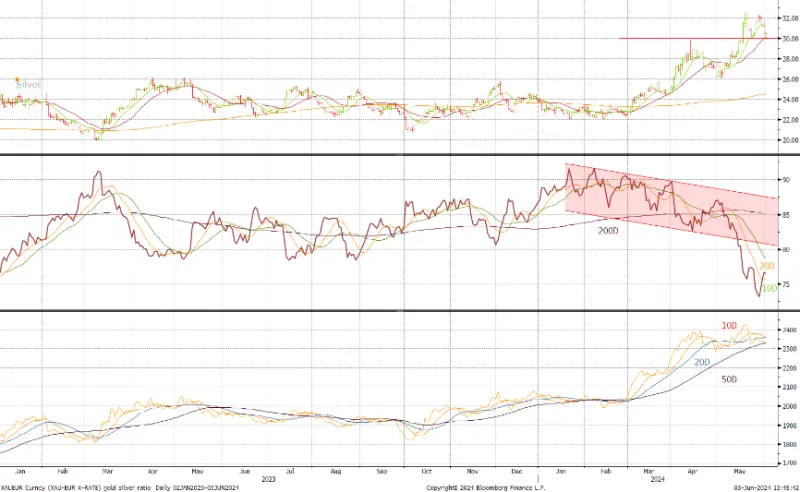
Gold, silver and the ratio, January 2023-to-date
Source: Bloomberg, StoneX
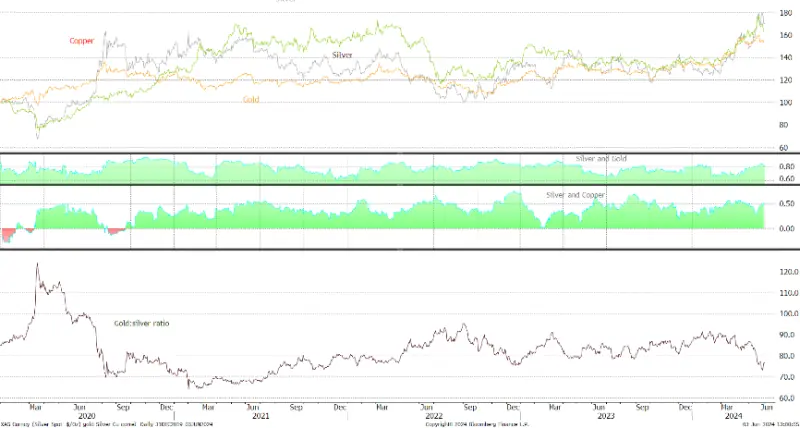
While gold‘s bull run 29th February to 20th May posted a gain of 21%, that of silver was 46%, which fits neatly with the usual relationship between the two – when gold stages a clear run in either direction, silver will usually do likewise, but by between twice and 2.5 times as much. This time the ratio was 2.2.
US economic indicators over the period continued to suggest that the US labour market is stabilising, while pending home sales in May were a lot lower than previously as higher mortgage rates continue to bite and home-owners locked into lower-rate mortgages are reluctant to sell and shoulder a higher burden. Real (i.e. inflation-adjusted) personal spending in the States was also negative on a year-on-year basis.
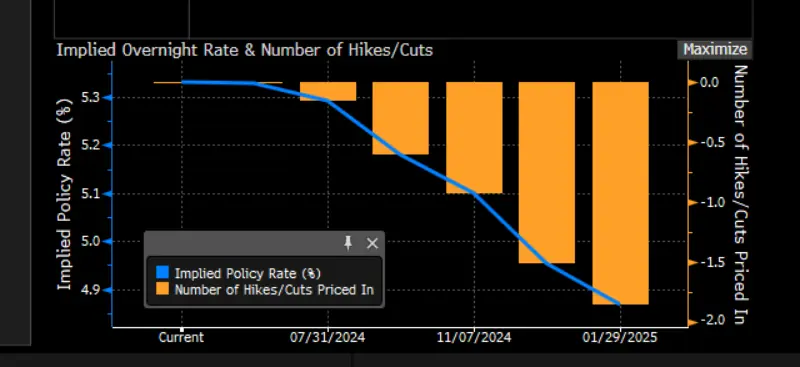
The inflation figures, however, were less encouraging for the Fed, which is attempting to fulfil its dual mandate of inflation at 2% and “full employment”. At the headline level the numbers were as expected, with the Core Personal Consumption Expenditure Index, a key parameter watched by the Fed, posted a month-on-month print of +0.30% but the year-on-year number was 2.80%. The StoneX Senior Strategist, Nick Reece, looked deeper into the figures and points out that core services (i.e. excluding food and energy) and also stripping out shelter costs, which apparently is Fed Chair Powell’s preferred indicator, is “reaccelerating on [a six-month] annualised basis, running at 4.1%”. The bond markets are still pricing in a 49% chance of a 25-point cut in September, and a 60% probability of one in December. November appears to be no longer on the cards.
Bond markets’ expectations for the rate cycle
Source: Bloomberg
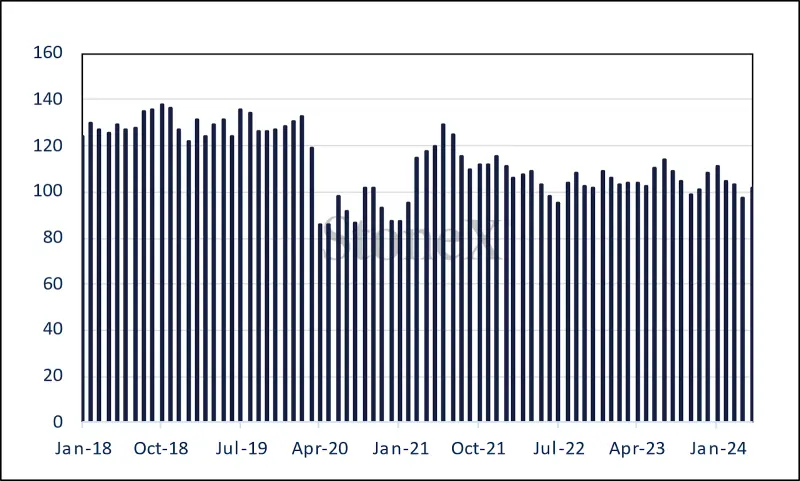
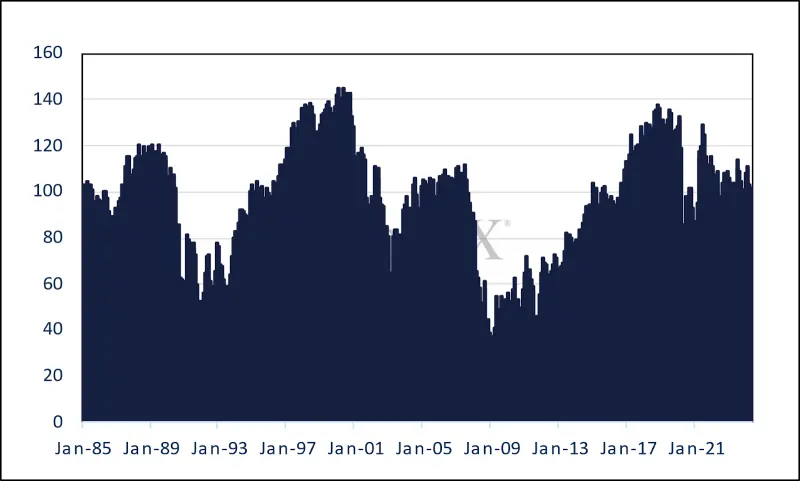
On a brighter note, the Conference Board indices were all better than expected, with the present situation index reading 143.0 and the Consumer Confidence posting 102.0, but the overall profile is not that robust.
US Conference Board Consumer Confidence index, short term and long-term
Source: Bloomberg, StoneX
Meanwhile the Fed Beige Book, which is a grass roots study of economic activity in different US Districts, was released last week with most Districts reporting only modest growth and two districts reporting no change, but also “heightened price sensitivity among consumers”. Auto sales are flat and a few districts have started to offer incentives. Here, too, tight credit conditions were a feature, constraining lending growth.
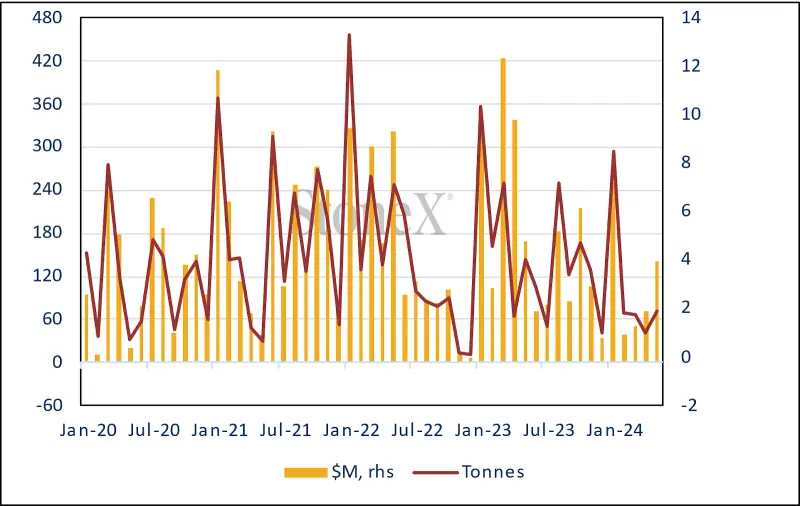
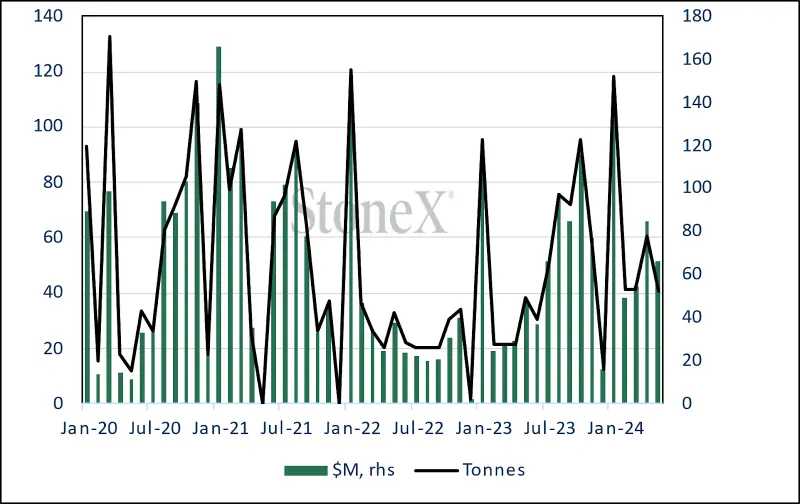
US Mint Gold and silver Eagle sales, tonnage and approximate value of contained metal
Source: US Mint, StoneX
As far as US coin sales are concerned, the latest figures from the US Mint make interesting reading. The approximate average value of the contained gold in gold Eagles in February-December 2023 (January excluded because that includes new year distribution to agents) was $164M. In March-May this year, as prices soared, the average tonnage of gold Eagle sales dropped by 59%, against the 2023 numbers and the dollar value of the contained gold fell by 46%. Silver held up rather better, with a 5% gain in tonnage terms and a 20% increase in approximate contained value at $159 per month.
In the background the gold Exchange Traded Products have been mixed. Of the 23 trading days so far in May gold had only ten days of net creations, but four of those have been in the past four days. Volumes have been cautious, totalling 7.8t over those four days and taking net sales to six tonnes in May, for a year-to-date fall of 149t to 3,076t (world mine production is roughly 3,700tpa). Silver saw just six days of net creations, for a monthly loss of 318t to 21,376t. Year-to-date the loss is 146t (global mine production is ~26,000tpa).
Gold, silver and copper; silver correlation with gold, 0.81; with copper, 0.28
Source: Bloomberg, StoneX
COMEX; sentiment mixed
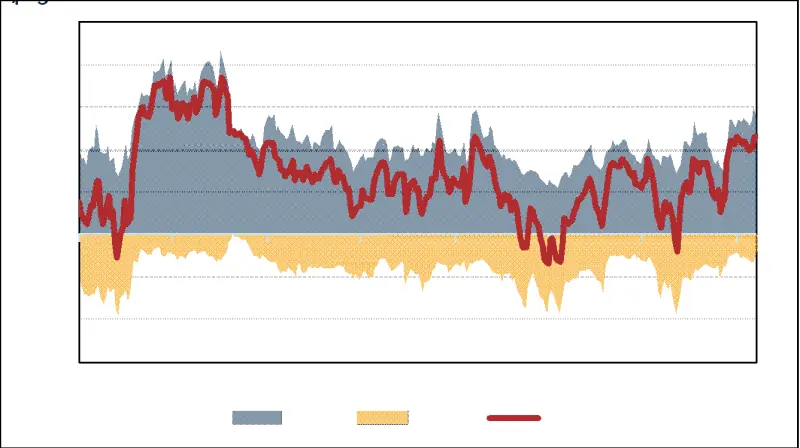
The Commitments of Traders reports for the fortnight to 28th May, during which time gold scaled new highs ($2,540, 20th May) and then reversed, saw longs exploding upwards and then retreat, moving from 535t to 593t and back to 543t. Shorts rose slightly initially, from 129t to 131t, before lively short covering, even as prices eased, to 80t, the lowest since mid-May 2020, bringing the net position up to 463t. The outright long, at 543t, is still 28% over the 12-month average (422t), so it continues to decline, but is still toppy.
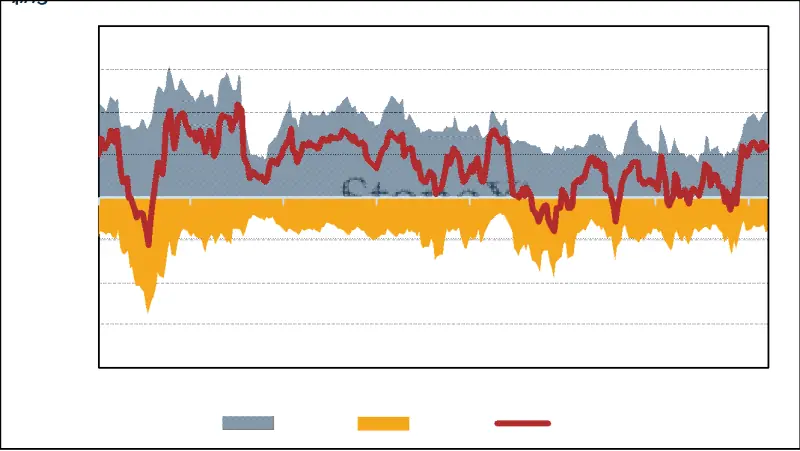
Silver opened the period at $28.19, shot up to $32.52, corrected to $30, and rallied again to close the fortnight at $32. Longs added just 3% to 10,006t and shorts actually expanded, adding 19% to 3,936t. All of which does point to the physical market rather than the futures – in the United States, at least. Action on the Shanghai Futures Exchange almost trebled in May against May 2023, which suggests plenty of interest on that side of the world. The COMEX net long was 6,069t on 28th May against a 12-month average of 2,138t.
Gold COMEX positioning, Money Managers (t)
Source: CFTC, StoneX
COMEX Managed Money Silver Positioning (t)
Source: CFTC, StoneX

Source: Bloomberg, StoneX