Jan 2024
Jan 2024
Gold faltering, needs time to consolidate above $2,000
By StoneX Bullion
- Gold outlook is positive for this year, due to a range of uncertainties. Trading at $2,025 as we write
- Since our last note, a fortnight ago, prices are unchanged, but have rallied and slipped over the period; currently at $2,024 having tested $2,065 and then $2,000
- Physical demand has been strong in China ahead of the New Year
- China’s silver demand is rampant on the back of the solar industry
- But overall economic uncertainty is weighing on silver and the recent uptrend has been broken
- The markets are finally accepting that a Fed rate cut in March is very unlikely
Gold and silver market sentiment remains cautious but the geopolitical and financial environments are gold-friendly, while silver is cautious on the back of uncertain economic projections despite a healthy long-term horizon.
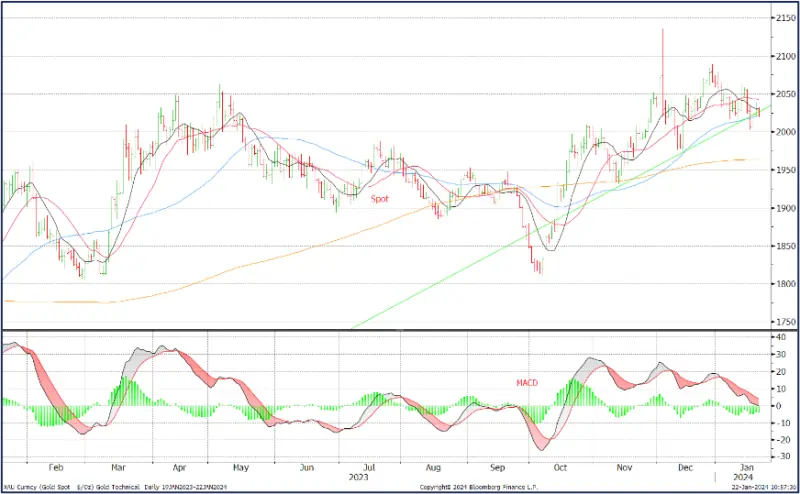
Gold technical, six months view; mixed. Spot is below the 20D MA, above the others. MACD (a key short-term indicator) still negative
Source: Bloomberg, StoneX
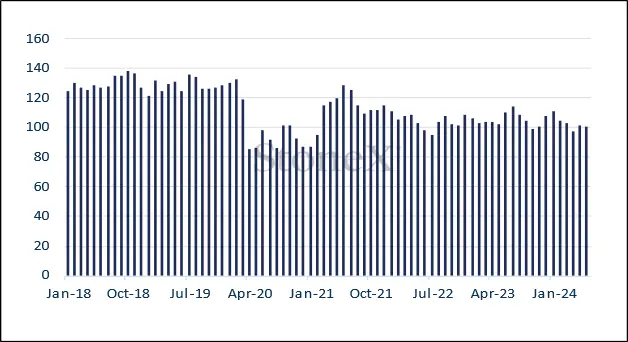
FOMC fed funds rate projections
December
Source: The Federal Reserve
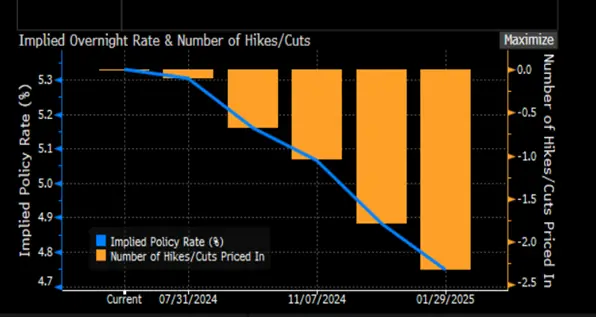
Source: Bloomberg
Gold’s advance towards $2,050 was the completion of an upward move that started in mid-December after prices had dropped to support at $1,970. Supportive factors included a relatively tame set of Producer Price numbers in the United States, which propelled the focus again towards a potentially softer path for the Fed’s rate cycle (it won’t necessarily happen, but perception is very important in driving market short-term sentiment), and this was compounded by increased tension in the Middle East as strikes from the United States and the UK on Houthi targets were confirmed. This was at the end of the second week of January; thereafter spot prices lost $50 in the space of two trading days as the dollar strengthened and retail sales were a lot higher than the markets had been expecting at 0.6% (5.6% year-on-year), especially at the core level (excluding food service, gas, building material and the auto sector), which posted a 0.8% gain (also 5.6% Y/Y). Autos were surprisingly strong, as were clothing and department stores, although there could very easily have been a Christmas effect in the latter two categories.
Gold and the two-year and ten-year yields, January 2021 to date
Source: Bloomberg, StoneX
Either way it was enough to take some heat out of the gold market, demonstrating that while the tailwinds are still strong for gold, the market is not aggressively bullish.
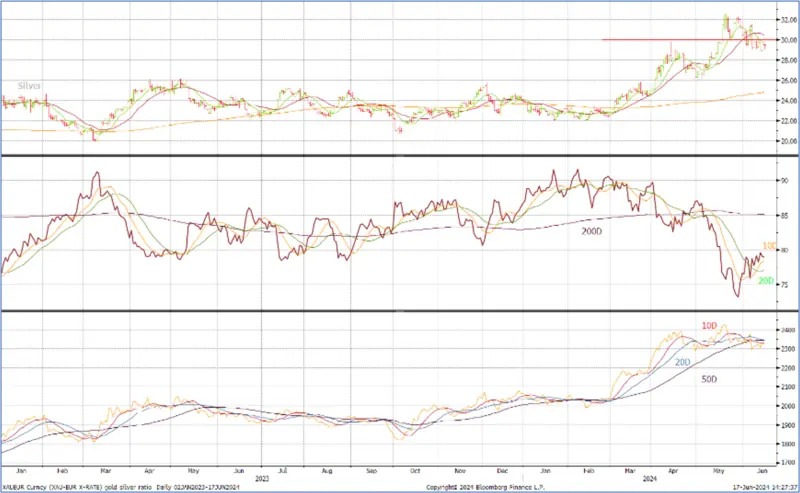
Silver technical; uptrend severed, and the moving average conformation is bearish, as is the MACD

Source: Bloomberg, StoneX
Silver, meanwhile, is playing a contrary game. Although the long-term outlook for silver demand is very strong, driven particularly by the onward march of the solar industry (especially in China) and vehicle electrification, sentiment overall is still very cautious on the back of economic uncertainty and gold’s stuttering performance. As a consequence, since our note of a fortnight ago silver prices showed little inclination to follow gold higher and with the exception of a short-lived jump from $22.50 to test $23.50, prices have been on a downward trajectory and as we write silver is between $22.00 and $22.20. The ratio between the two metals has widened particularly noticeably in recent days, running up from 89.0 to 91.3 in just two days to post the highest since early September 2022, when gold was part of the way through a ten-week bear run from $2,070 to $1,650 and silver was hovering below $21.
Gold silver and the ratio; silver’s correlation with gold and with copper

Source: Bloomberg, StoneX
Exchange Traded Products
In the ETP sector, the latest numbers from the World Gold Council (the most reliable source) showed a fall of 244t in 2023 (for a funds exodus of $14.7Bn) to 3,226t. World mine production is roughly 3,650t. The Council’s tonnage numbers for this year so far only go to 5thJanuary and show holdings of 3,185t, implying a drop of 41t. Bloomberg numbers for the following fortnight suggest a further fall amounting to 23t with only two days of net creation from a total of ten.
Silver ETPs have also been under pressure so far this year, which given the price action should come as no surprise. Of eleven trading days so far, only four have seen net creations, for a drop of 170t to 21,600t. Over 2023 as a whole the silver ETPs dropped from 23,296t to 21,770t (world mine production is approximately 26,500t). This was therefore a fall of 1,526t, equivalent to three weeks’ global mine production.
Gold spot price vs ETF holdings
Source: Bloomberg, StoneX
Silver spot price vs ETF holdings; strong-ish positive correlation since mid-December

Source: Bloomberg, StoneX
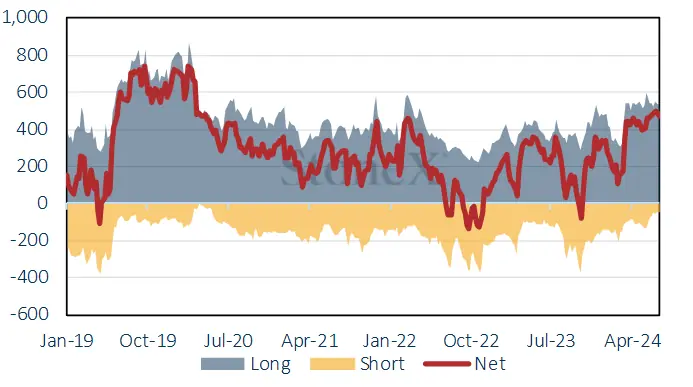
Futures positioning
From the start of the year through to 16th January gold and silver have both been under a cloud on COMEX. Gold has seen a drop of 73t (17%) in outright longs over the period, notably the first week, while outright shorts have nudged almost imperceptibly higher, rising by 5% and leaving the net position at 259t long against a 12M average of 222t. Silver was more aggressive with a 21% drop in long and a 13% increase in shorts, taking the net long position from 2,581t to 1,000t, and compared with a 12M average of 1,603t.
At end-2022 gold was showing a net long of 158t and at end-2023 that position was a net long of 218t; the silver net long had been 4,632t and by end-year was down to 2,700t, demonstrating silver’s lack of attraction last year compared to gold. For the time being silver is still under something of a cloud.
Gold COMEX positioning, Money Managers (t)

Source: CFTC, StoneX
COMEX Managed Money Silver Positioning (t)

Source: CFTC, StoneX

Source: Bloomberg, StoneX