Jan 2023
Jan 2023
StoneX Bullion round-up Monday 23th January 2023
By StoneX Bullion
Gold consolidating in new range; downward pressure on US inflation levels is fading
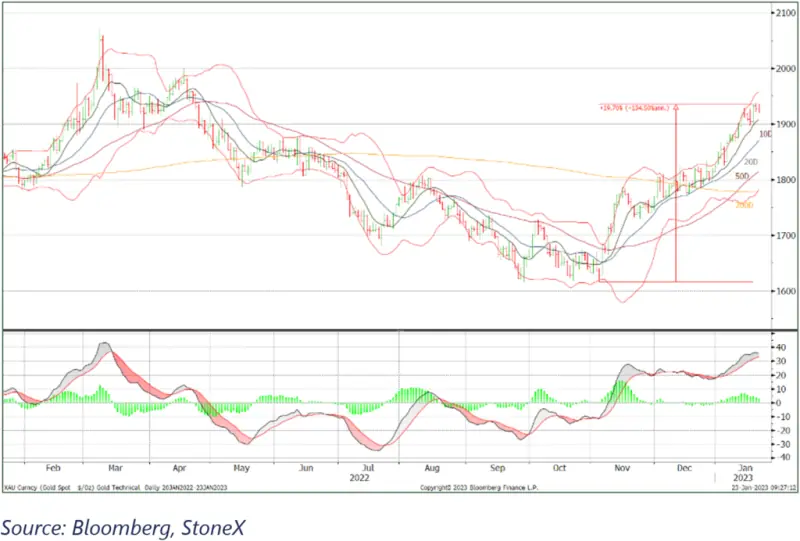
After a 20% gain in dollar terms from the start of November through to last Monday 16th January, gold is now taking a much-needed period of consolidation, trading between $1,900 and $1,930. Despite being technically overbought for most of January, prices have held up well and this recent correction has found support from the ten-day moving average, which at time of writing stands at $1,909.
Spot Gold, technical annotations
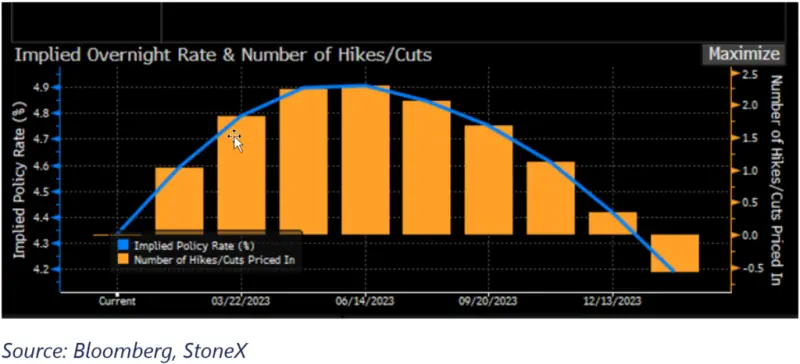
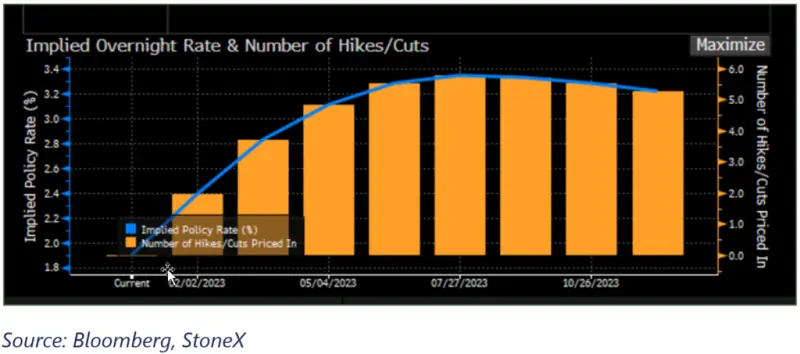
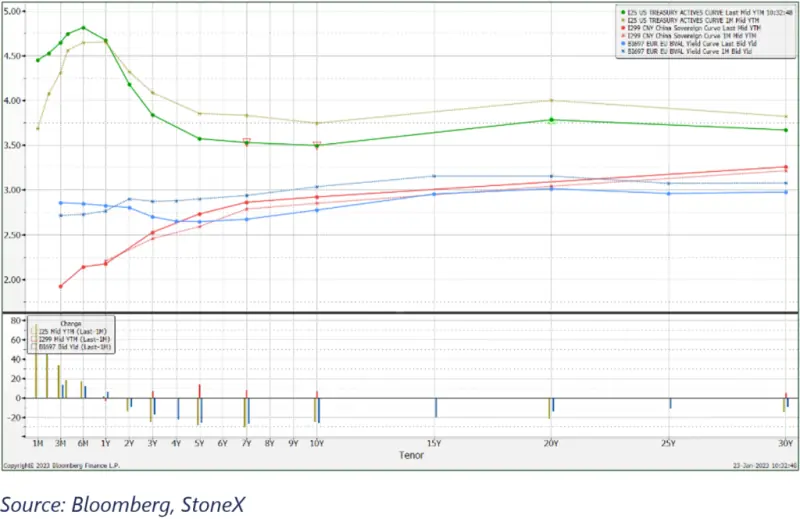
Prices have posted solid gains in other currencies also, with an 8% gain in Swiss franc terms in this most recent move, although prices are 10% higher than the low posted in mid-September. In euros, the recent surge has put on 6%, while the advance from the late-October low is 7%. As we have noted in our two most recent commentaries, this gain is believed to be largely driven by investors looking to mitigate risk and in anticipation of a slowing in / cessation of the Fed’s rate cycle. This has been extended by the openly hawkish European Central Bank stance. The latter is not necessarily a function of interest-rate differentials; in our view it is more a case of highlighting the intertwined economic and geopolitical risks in the region, leading to gold acquisition for risk mitigation purposes. Indeed, the bond markets are forecasting a peak in US rates at 4.5% in June, with EU rates peaking a month later at 3.3%, well below the dollar rates.
Other supportive elements have been disappointing economic numbers from the United States. The housing market remains under pressure and although housing starts in December were higher than expected they were still lower than in November and building permits are still contracting. The CPI and PPI were both negative, with falls in all the major key areas, but it is important to be aware that the falls in energy prices will work their way through the system and this will remove some of the downward pressure on these indices. This time last year the markets were trying to assess whether inflationary pressures were transitory or feeding permanent expectations; it is arguable that the situation has reversed and the reduction in inflationary forces is starting to wash through the system.
It still looks as if bond markets’ projections are too benign, given the rhetoric from the bankers themselves and we may yet find the bond markets coming under pressure accordingly. That would take some of the sheen off gold but would be unlikely to see its price trajectory reverse course.
US fed funds implied overnight rates
EU bond markets’ implied rates
This week sees the celebration of the Lunar New Year (Year of the Rabbit, associated with peace, serenity, success) with the Chinese markets closed from last Saturday 21st through to Friday 28th. This may have taken a little momentum out of gold’s bull run, but this is a good thing as the market did need to settle down.
One area that is still indifferent to gold is the Exchange Traded Products; since the start of the year. In the 15 trading days year-to-date only three have seen new creations and the net redemption thus far is 7.6t. That said, the rate of erosion, in line with that of December, is much slower than it was for much of 2022; from January-November inclusive the average monthly loss was 10tpm, so the fall is now running 30% more slowly than in that earlier period.
Silver’s change of range came in December (silver often does move first as professional investors get silver exposure before gold as it is a smaller market and not as liquid as gold -although COMEX trades in volumes more than 100 times that of the underlying physical mine production, whereas gold’s ratio is more like 65:1). Since briefly clearing $24 in December silver has oscillated around that level and the gold:silver ratio has widened, standing now at 81, against an average of 2022 of 83. Silver ETPs have had six days of creations so far this year but there was some quite chunky liquidation last week, most likely in response to the fact that it had stopped rising and potentially also influenced by increasing signs of a slowdown in the US economy.
As far as futures positioning is concerned, the week to 24th January, during which time gold ran from $1,867 to $1,903 (intraday) saw another 20t added to the long side, but little change in the shorts. That took the net long to 216tt or 58% higher than the 12-month average, which certainly means that wee now have a speculative overhang. Silver positioning saw a swing to the long side, with 195t of fresh longs and short covering of 325t. Silver thus stood at a net long of 4,255t against a 1,711t 12-month average so there is the potential for further stale bull liquidation here, also.
The U.S., E.U. and China yield curves
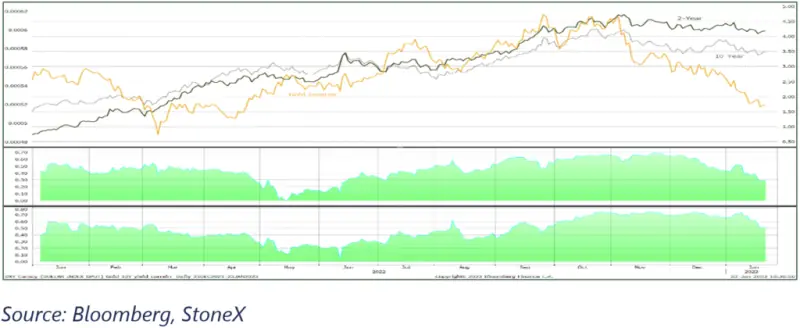
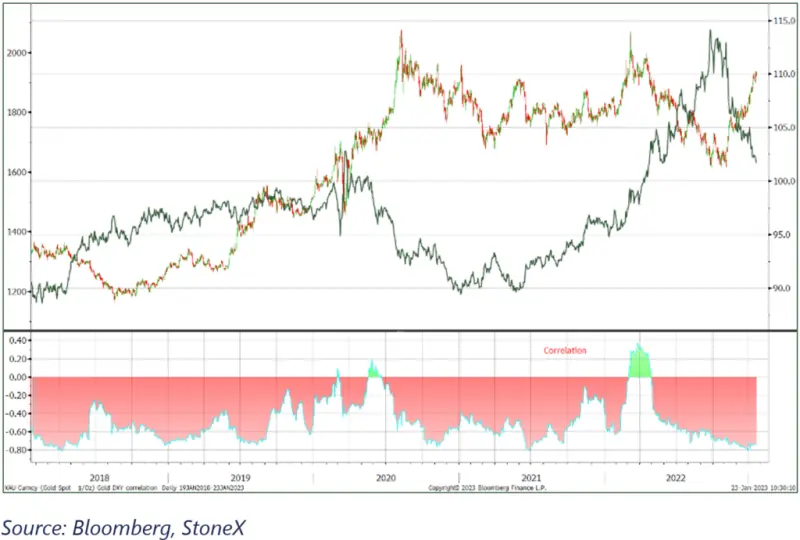
Gold, the dollar, and their correlation
Source: Bloomberg, StoneX
Gold (inverted) and the two and ten-year yields; correlation with the 10Y
